

Question: please try this with R programming language if possible For each distribution below, generate a plot of the distribution (using a Kernel density) and calculate
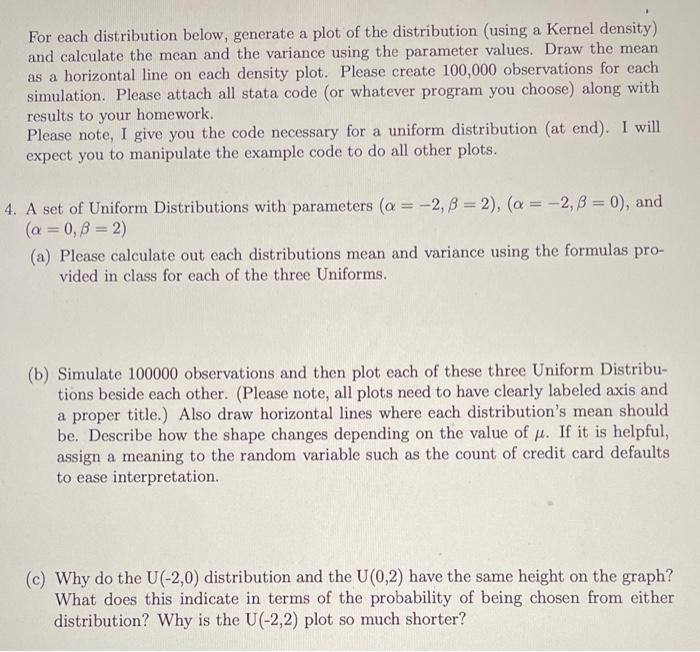
For each distribution below, generate a plot of the distribution (using a Kernel density) and calculate the mean and the variance using the parameter values. Draw the mean as a horizontal line on each density plot. Please create 100,000 observations for each simulation. Please attach all stata code (or whatever program you choose) along with results to your homework. Please note, I give you the code necessary for a uniform distribution (at end). I will expect you to manipulate the example code to do all other plots. 4. A set of Uniform Distributions with parameters (=2,=2),(=2,=0), and (=0,=2) (a) Please calculate out each distributions mean and variance using the formulas provided in class for each of the three Uniforms. (b) Simulate 100000 observations and then plot each of these three Uniform Distributions beside each other. (Please note, all plots need to have clearly labeled axis and a proper title.) Also draw horizontal lines where each distribution's mean should be. Describe how the shape changes depending on the value of . If it is helpful, assign a meaning to the random variable such as the count of credit card defaults to ease interpretation. (c) Why do the U(2,0) distribution and the U(0,2) have the same height on the graph? What does this indicate in terms of the probability of being chosen from either distribution? Why is the U(2,2) plot so much shorter
Step by Step Solution
There are 3 Steps involved in it

Get step-by-step solutions from verified subject matter experts