

Question: please try to answer all the questions Problem 3. Data summarized in the table below show how enzyme concentration (42.2 C (mg/L) 82.8) in a
please try to answer all the questions
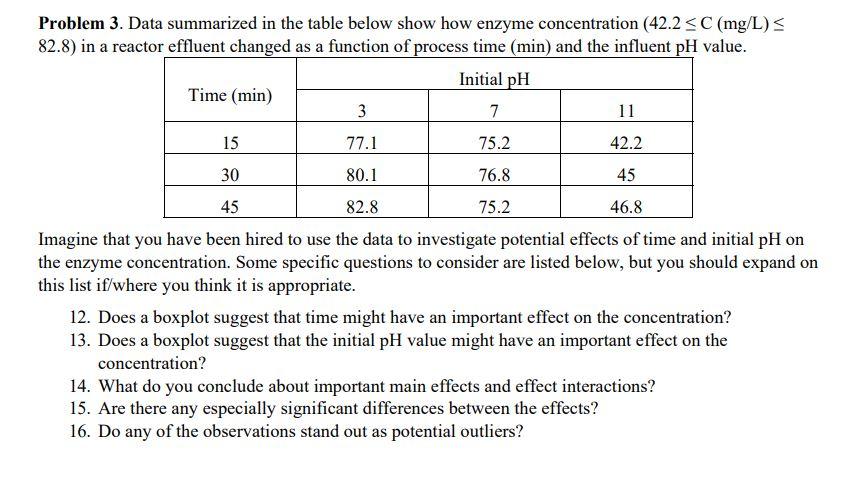
Problem 3. Data summarized in the table below show how enzyme concentration (42.2 C (mg/L) 82.8) in a reactor effluent changed as a function of process time (min) and the influent pH value. Initial pH Time (min) 3 7 11 15 77.1 75.2 42.2 30 80.1 76.8 45 45 82.8 75.2 46.8 Imagine that you have been hired to use the data to investigate potential effects of time and initial pH on the enzyme concentration. Some specific questions to consider are listed below, but you should expand on this list if/where you think it is appropriate. 12. Does a boxplot suggest that time might have an important effect on the concentration? 13. Does a boxplot suggest that the initial pH value might have an important effect on the concentration? 14. What do you conclude about important main effects and effect interactions? 15. Are there any especially significant differences between the effects? 16. Do any of the observations stand out as potential outliers
Step by Step Solution
There are 3 Steps involved in it

Get step-by-step solutions from verified subject matter experts