

Question: Please try to answer this as fast as possible correctly using R code. Thank you Problem 4: Consider data set cars, which is available in
Please try to answer this as fast as possible correctly using R code. Thank you
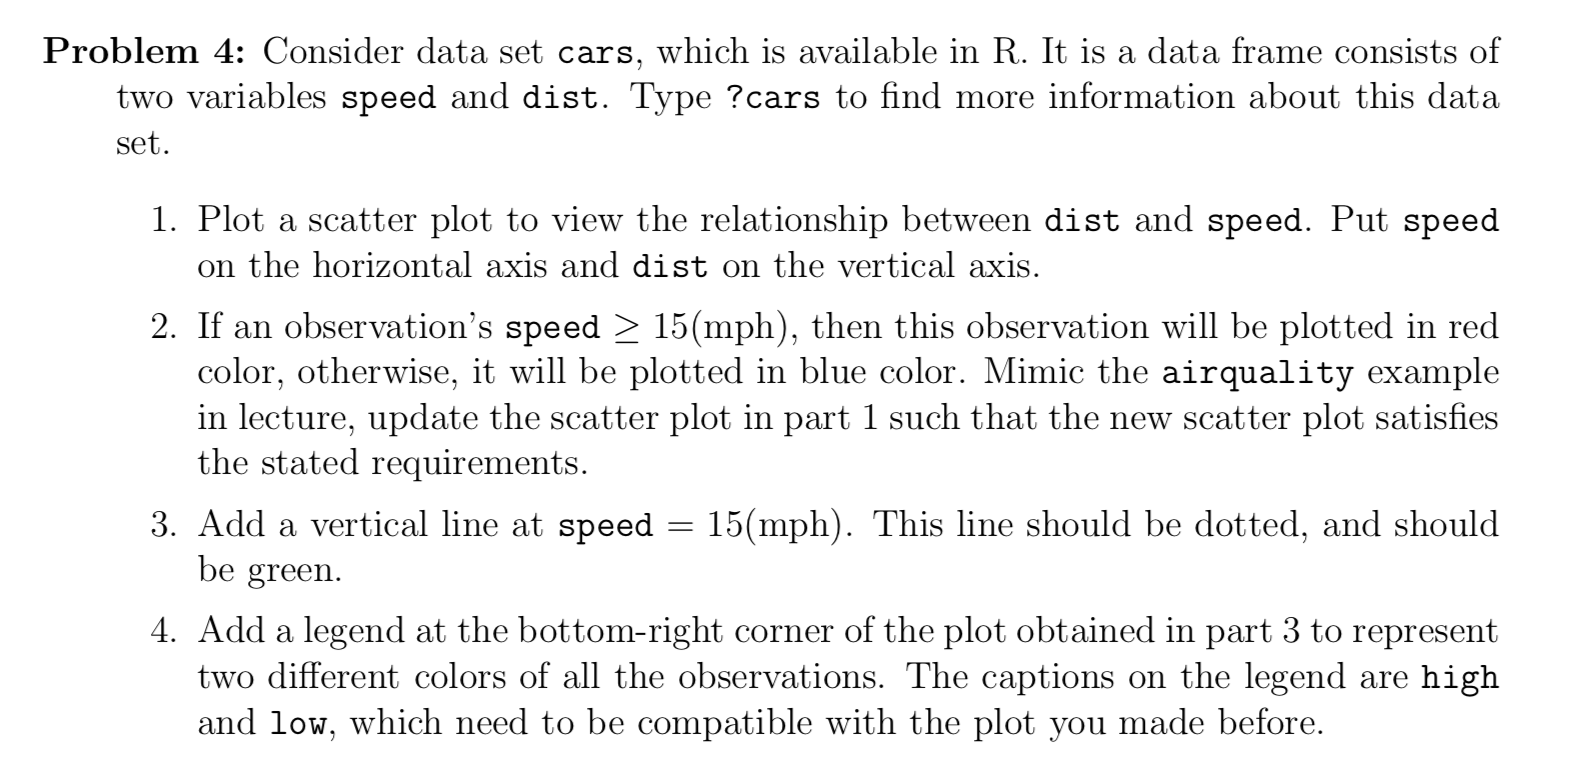
Problem 4: Consider data set cars, which is available in R. It is a data frame consists of two variables speed and dist. Type ?cars to nd more information about this data set. 1. Plot a scatter plot to view the relationship between dist and speed. Put speed on the horizontal axis and dist on the vertical axis. If an observation's speed 2 15(mph), then this observation will be plotted in red color, otherwise, it will be plotted in blue color. Mimic the airquality example in lecture, update the scatter plot in part 1 such that the new scatter plot satises the stated requirements. Add a vertical line at speed 2 15(mph). This line should be dotted, and should be green. Add a legend at the bottomright corner of the plot obtained in part 3 to represent two different colors of all the observations. The captions on the legend are high and low, which need to be compatible with the plot you made before
Step by Step Solution
There are 3 Steps involved in it

Get step-by-step solutions from verified subject matter experts