

Question: Please try to do all parts Data table Data table Requirements 1. Perform a trend analysis on Tang's sales revenue, inventory, and receivables over the


Please try to do all parts
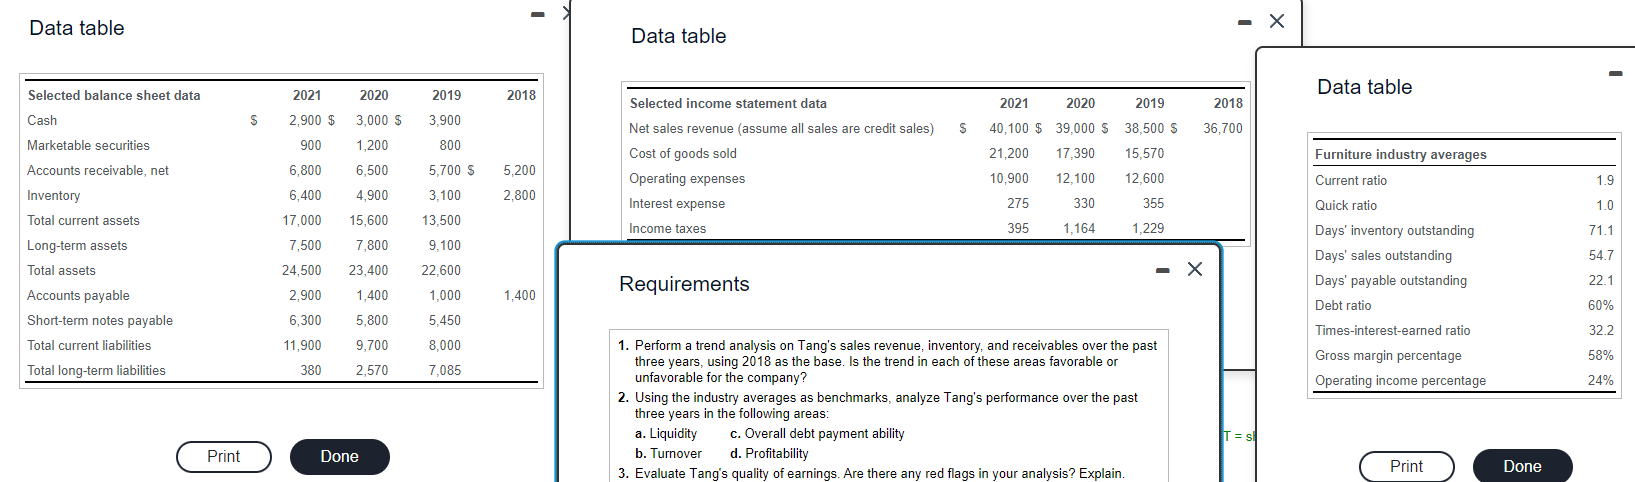
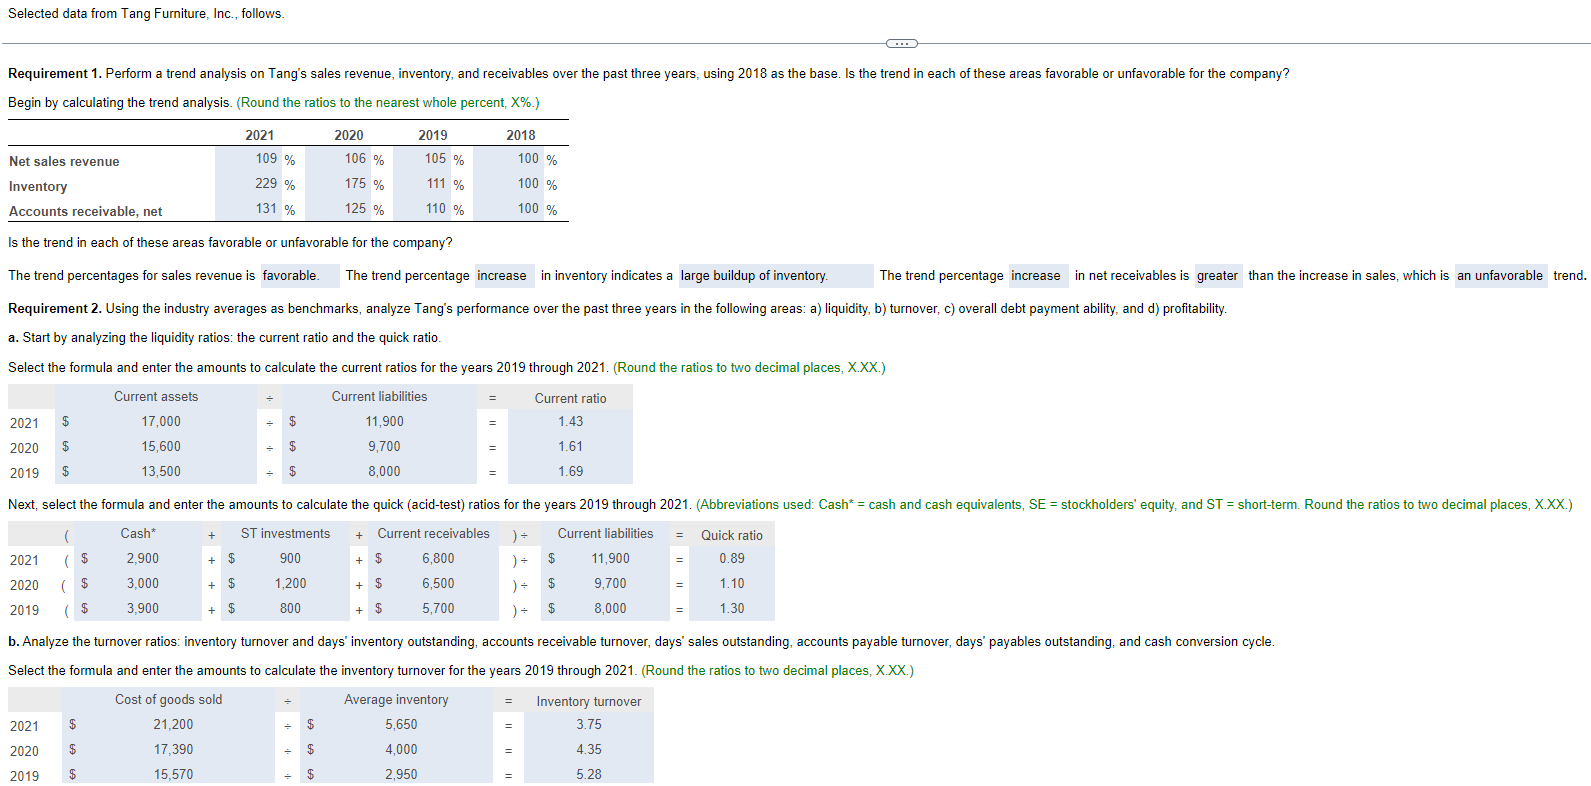
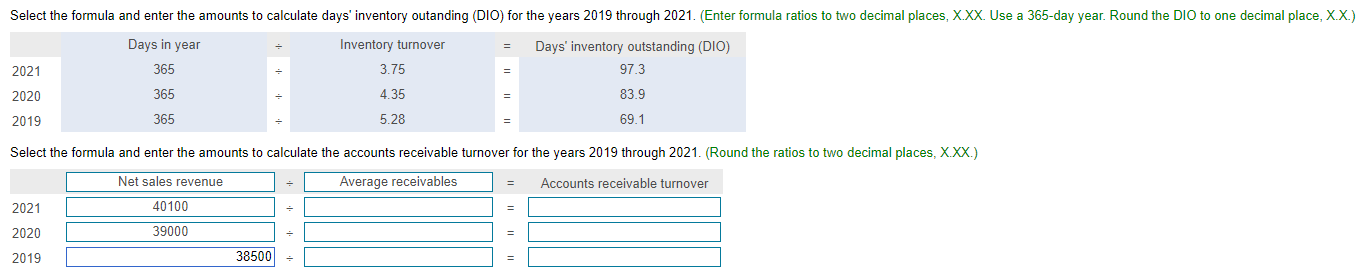
Data table Data table Requirements 1. Perform a trend analysis on Tang's sales revenue, inventory, and receivables over the past three years, using 2018 as the unfavorable for the company? 2. Using the industry averages as bent three years in the following areas: a.Liquidityb.Turnoverc.Overalldebtd.Profitability 3. Evaluate Tang's quality of earnings. Are there any red flags in your analysis? Explain. Begin by calculating the trend analysis. (Round the ratios to the nearest whole percent, X%.) Is the trend in each of these areas favorable or unfavorable for the company? The trend percentages for sales revenue is The trend percentage in inventory indicates a he trend percentage in net receivables is than the increase in sales, which is a. Start by analyzing the liquidity ratios: the current ratio and the quick ratio. Select the formula and enter the amounts to calculate the current ratios for the years 2019 through 2021. (Round the ratios to two decimal places, X.XX.) 202120202019Daysinyear365365365Inventoryturnover3.754.355.28=69.1Daysinventoryoutstanding(DIO)97.383.9 Select the formula and enter the amounts to calculate the accounts receivable turnover for the years 2019 through 2021. (Round the ratios to two decimal places, X.XX.) Data table Data table Requirements 1. Perform a trend analysis on Tang's sales revenue, inventory, and receivables over the past three years, using 2018 as the unfavorable for the company? 2. Using the industry averages as bent three years in the following areas: a.Liquidityb.Turnoverc.Overalldebtd.Profitability 3. Evaluate Tang's quality of earnings. Are there any red flags in your analysis? Explain. Begin by calculating the trend analysis. (Round the ratios to the nearest whole percent, X%.) Is the trend in each of these areas favorable or unfavorable for the company? The trend percentages for sales revenue is The trend percentage in inventory indicates a he trend percentage in net receivables is than the increase in sales, which is a. Start by analyzing the liquidity ratios: the current ratio and the quick ratio. Select the formula and enter the amounts to calculate the current ratios for the years 2019 through 2021. (Round the ratios to two decimal places, X.XX.) 202120202019Daysinyear365365365Inventoryturnover3.754.355.28=69.1Daysinventoryoutstanding(DIO)97.383.9 Select the formula and enter the amounts to calculate the accounts receivable turnover for the years 2019 through 2021. (Round the ratios to two decimal places, X.XX.)
Step by Step Solution
There are 3 Steps involved in it

Get step-by-step solutions from verified subject matter experts