

Question: please try to show as much steps as possible so i can understand, Thank you in advance! 4) The graph below represents the relationship between
please try to show as much steps as possible so i can understand, Thank you in advance!

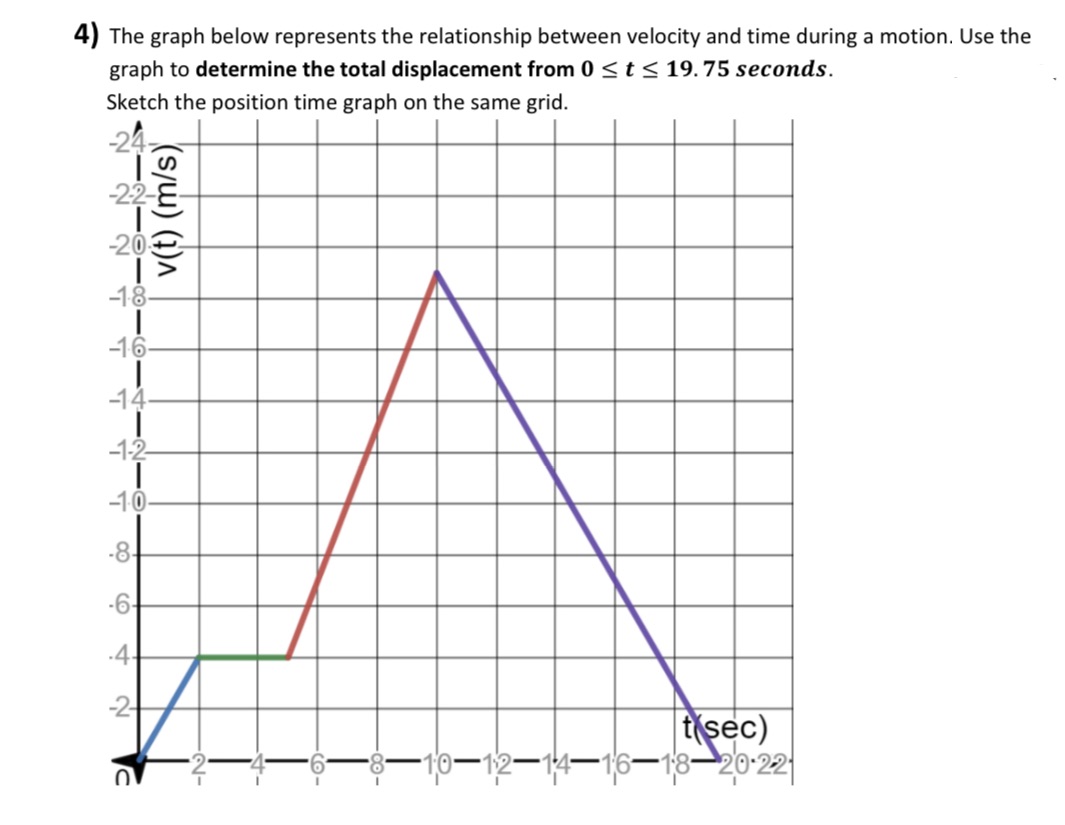
4) The graph below represents the relationship between velocity and time during a motion. Use the graph to determine the total displacement from 0 S t - 19. 75 seconds. Sketch the position time graph on the same grid. -24 -2:2 v(t) (m/s) -20 18 16. 14 -1-2 10 -8- -6- .4 -2- t(sec) -NO -4- - - 8-10-12-14-16-18-20-22
Step by Step Solution
There are 3 Steps involved in it
1 Expert Approved Answer
Step: 1 Unlock

Question Has Been Solved by an Expert!
Get step-by-step solutions from verified subject matter experts
Step: 2 Unlock
Step: 3 Unlock