

Question: Please type it out, or print it out (not in cursive) Question 3: The data in the table below represents the salary distribution in a
Please type it out, or print it out (not in cursive)
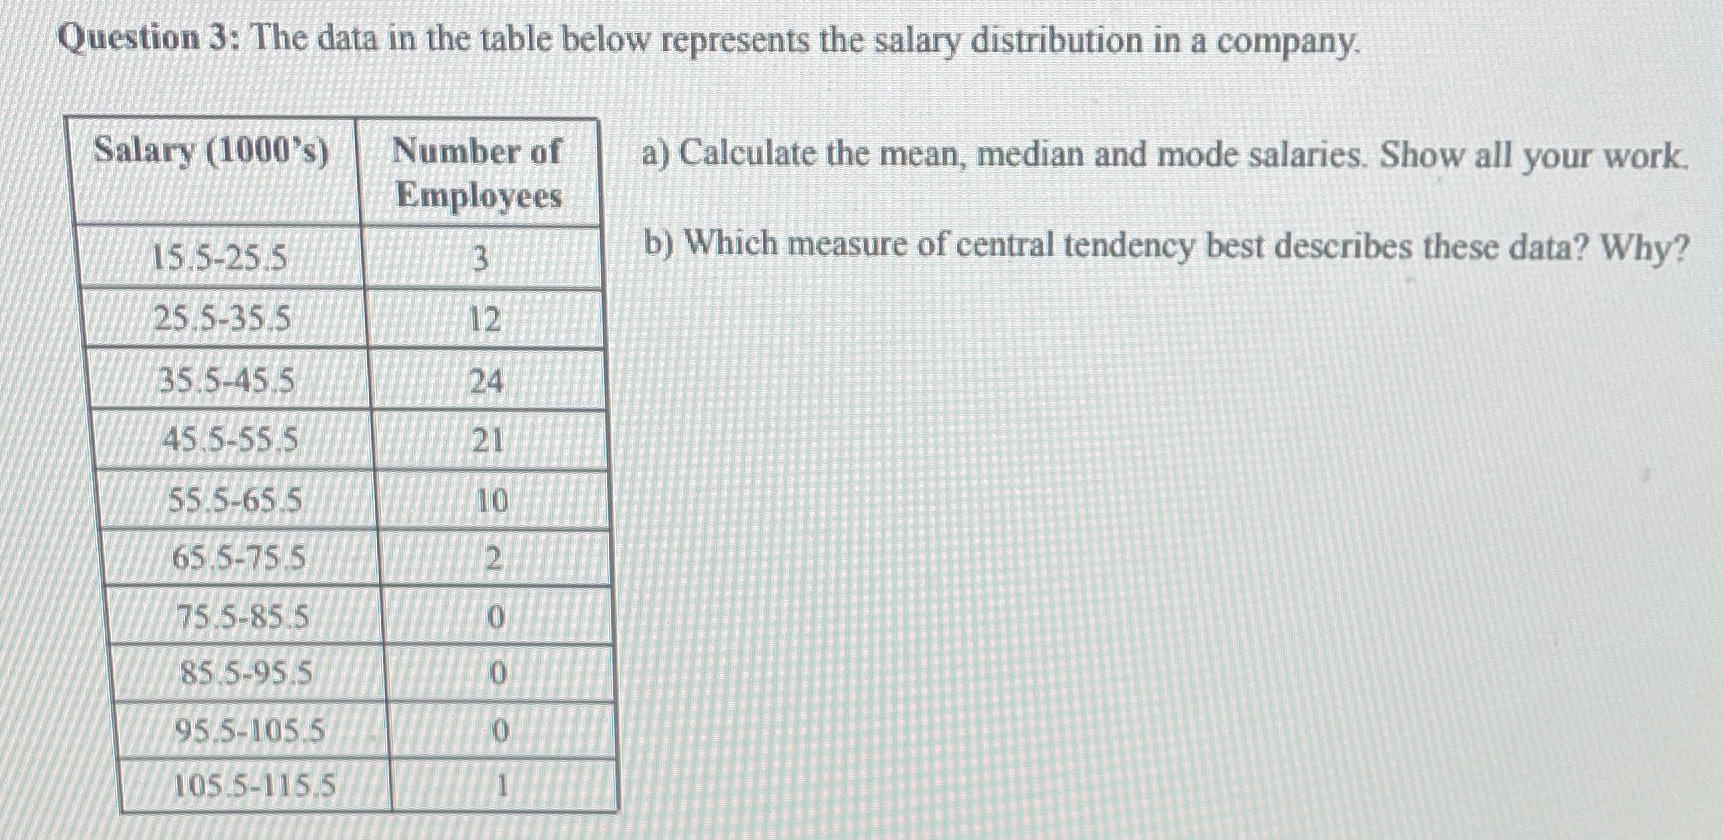
Question 3: The data in the table below represents the salary distribution in a company. Salary (1000's) Number of a) Calculate the mean, median and mode salaries. Show all your work. Employees 15.5-25/5 b) Which measure of central tendency best describes these data? Why? 25/5-35.5 12 35.5-45.5 24 45.5-55.5 21 55.5-65.5 10 65.5-75.5 75.5-85.5 85.5-95 5 95.5-105.5 105.5-115.5
Step by Step Solution
There are 3 Steps involved in it
1 Expert Approved Answer
Step: 1 Unlock

Question Has Been Solved by an Expert!
Get step-by-step solutions from verified subject matter experts
Step: 2 Unlock
Step: 3 Unlock