

Question: Please type or wri.te a.nswers clearly 1. 8. The figure shows a graph of the velocity of an object as a function of time. What
Please type or wri.te a.nswers clearly
1.
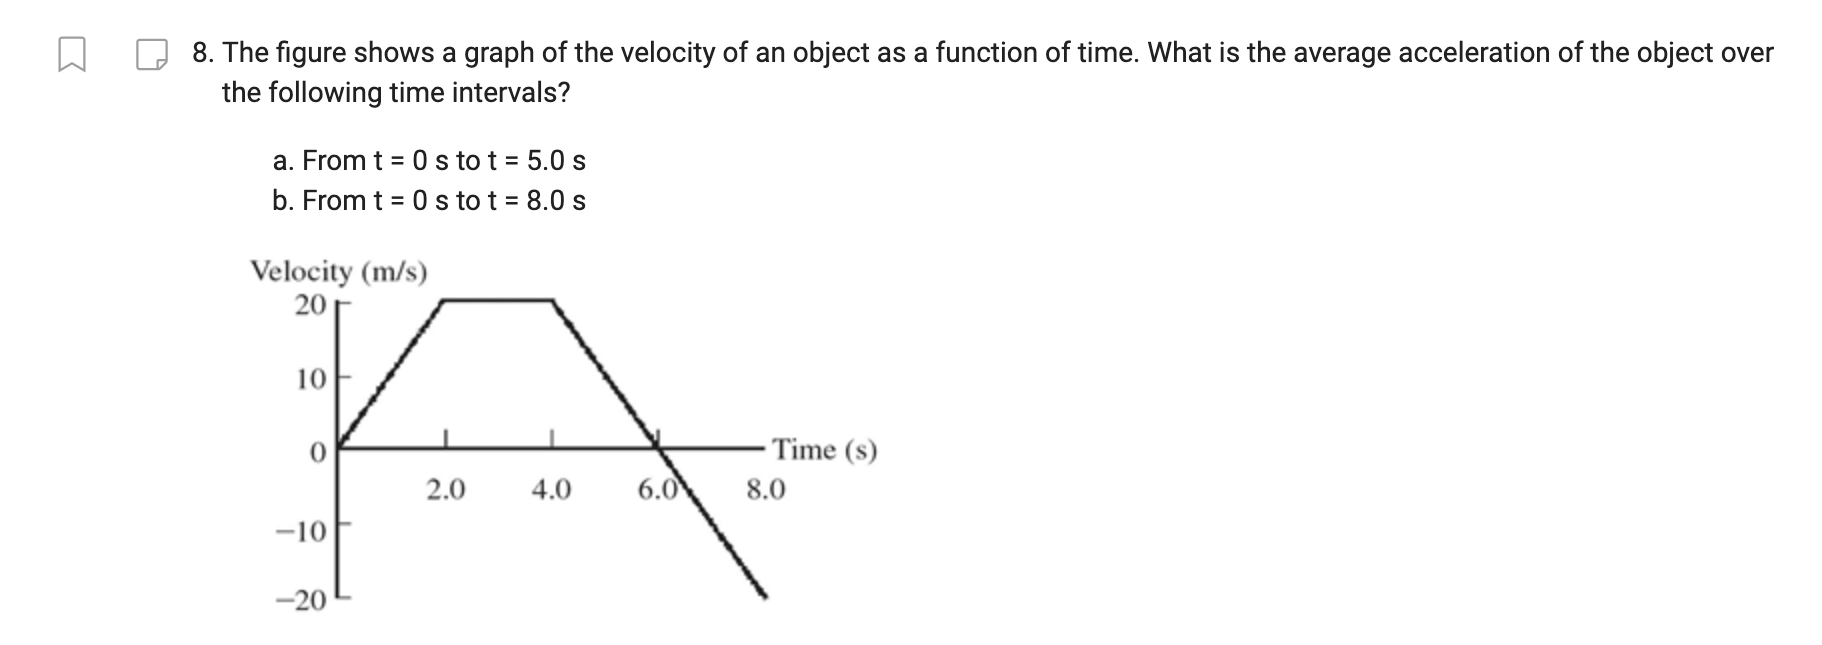
8. The figure shows a graph of the velocity of an object as a function of time. What is the average acceleration of the object over the following time intervals? a. From t = 0 s to t = 5.0 s b. From t = 0 s to t = 8.0 s Velocity (m/s) 20 10 0 Time (s) 2.0 4.0 6.0 8.0 -10 -20
Step by Step Solution
There are 3 Steps involved in it
1 Expert Approved Answer
Step: 1 Unlock

Question Has Been Solved by an Expert!
Get step-by-step solutions from verified subject matter experts
Step: 2 Unlock
Step: 3 Unlock