

Question: PLEASE TYPE OUT SOLUTIONS. DO NOT HAND WRITE. YOU CAN IGNORE THE CODING IN THE STEP. THE OUTCOME AT THE BOTTOM OF THE CODING HAVE
PLEASE TYPE OUT SOLUTIONS. DO NOT HAND WRITE.
YOU CAN IGNORE THE CODING IN THE STEP. THE OUTCOME AT THE BOTTOM OF THE CODING HAVE ARROWS POINTING AT THEM. THAT IS WHAT IS IMPORTANT. THANK YOU SO MUCH!
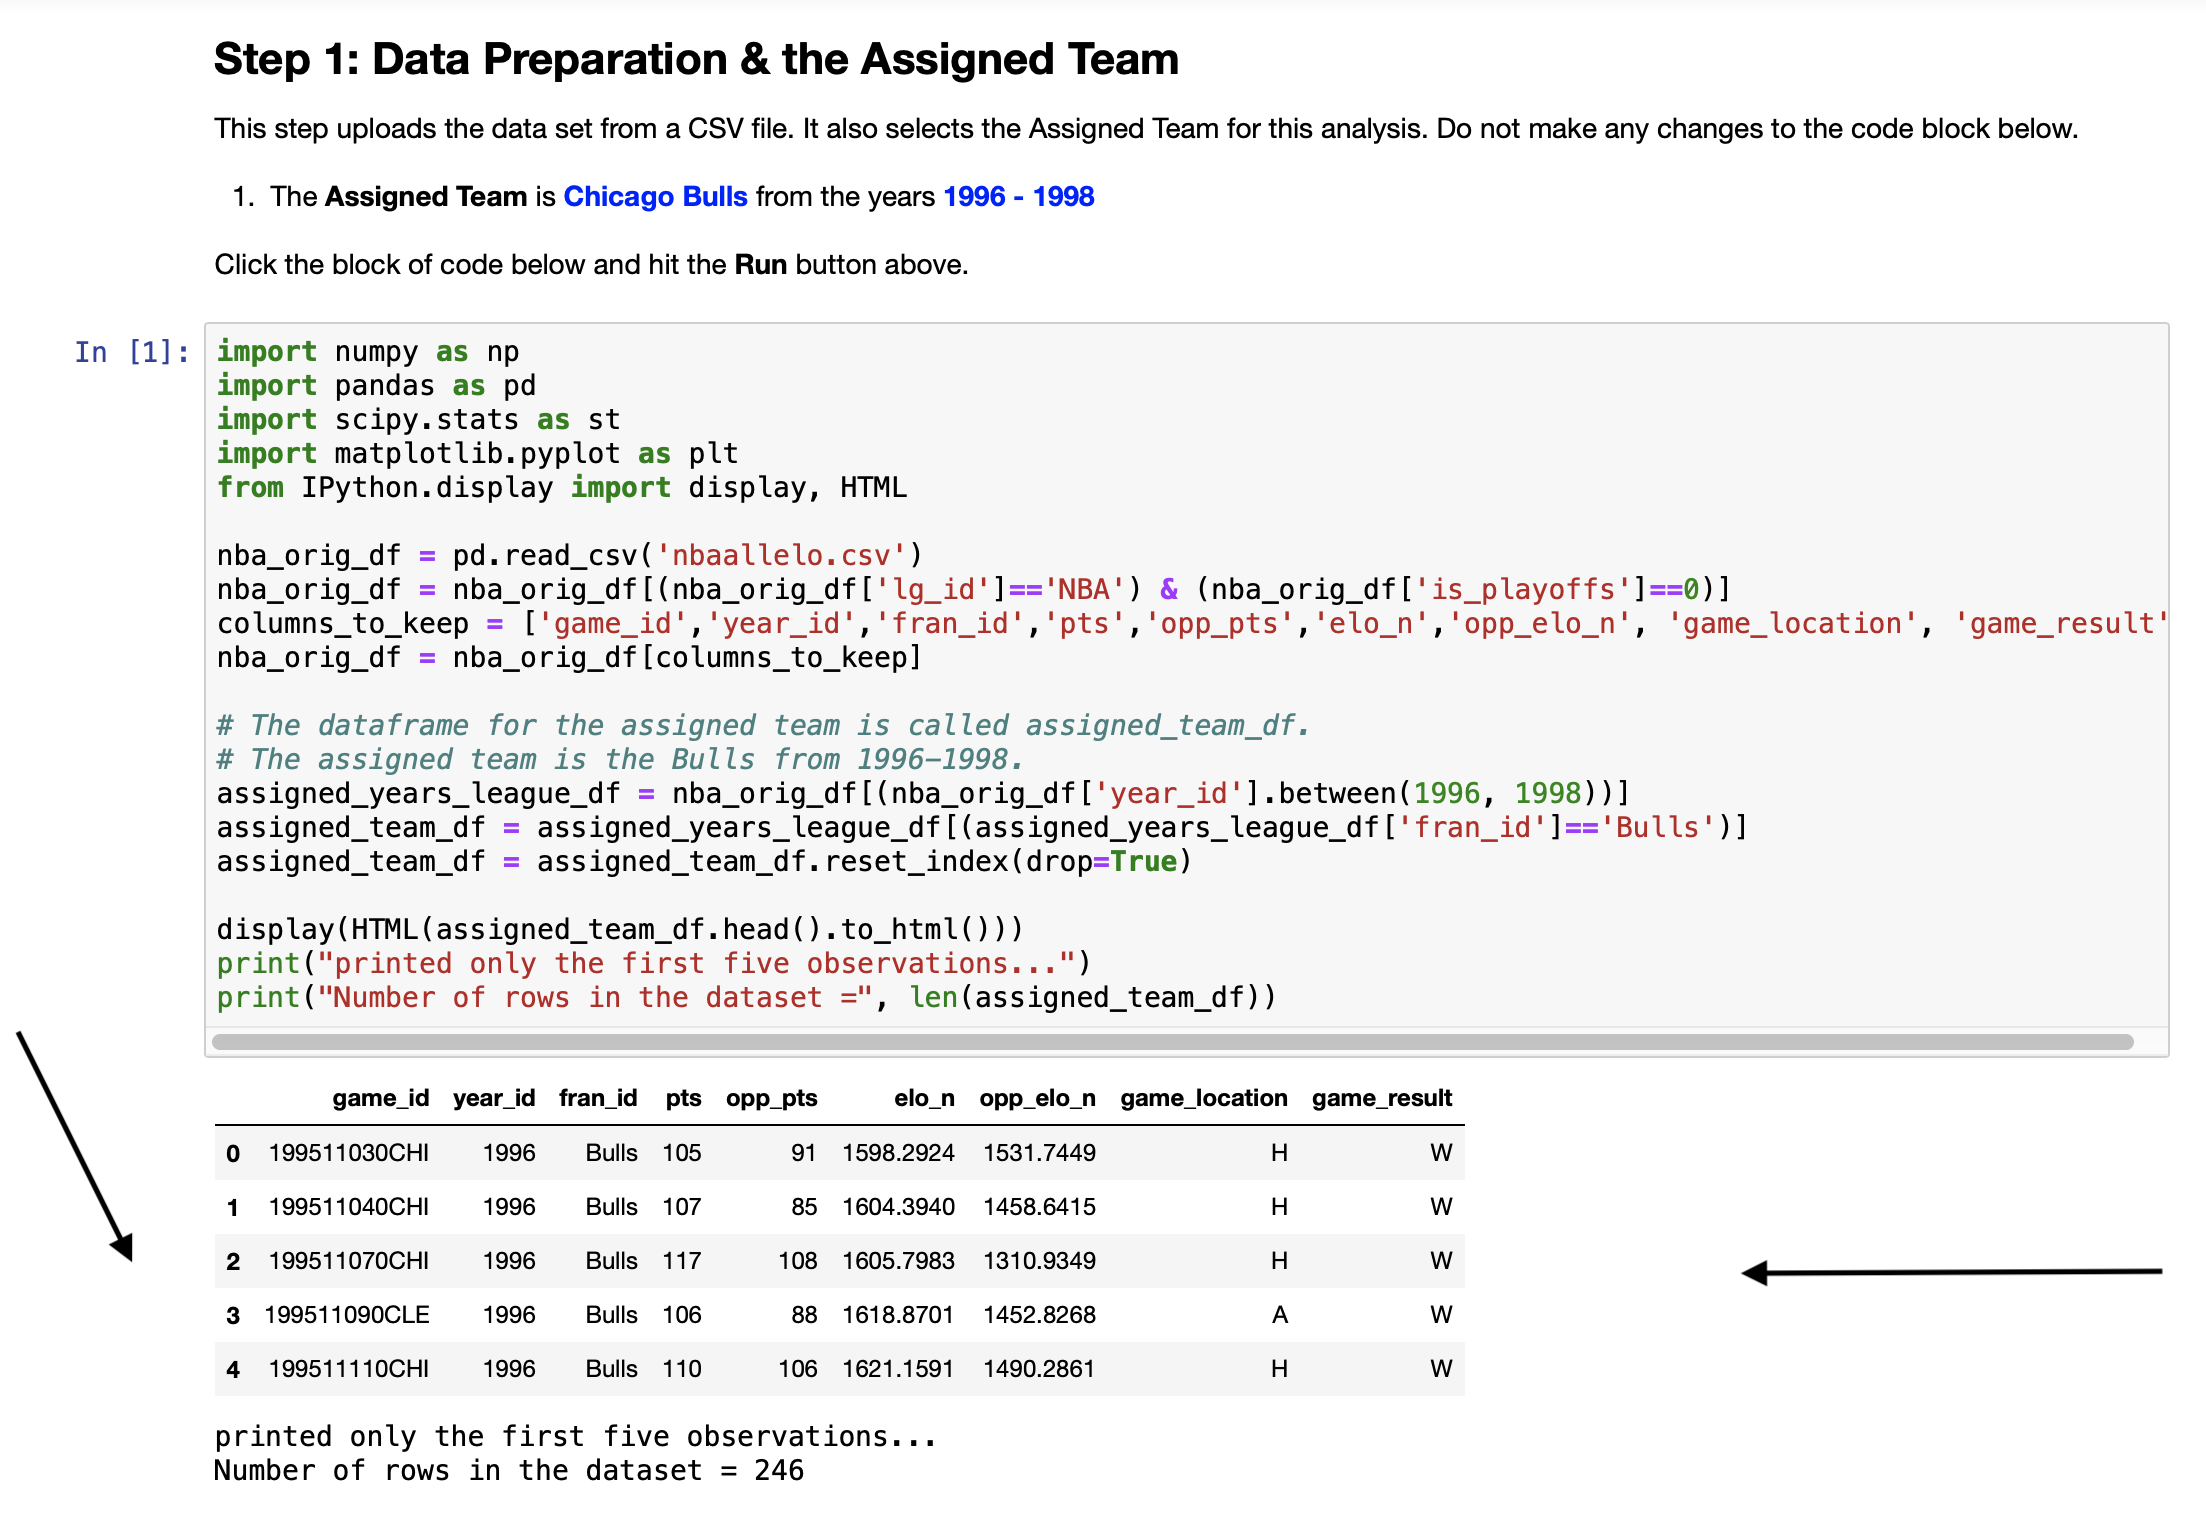
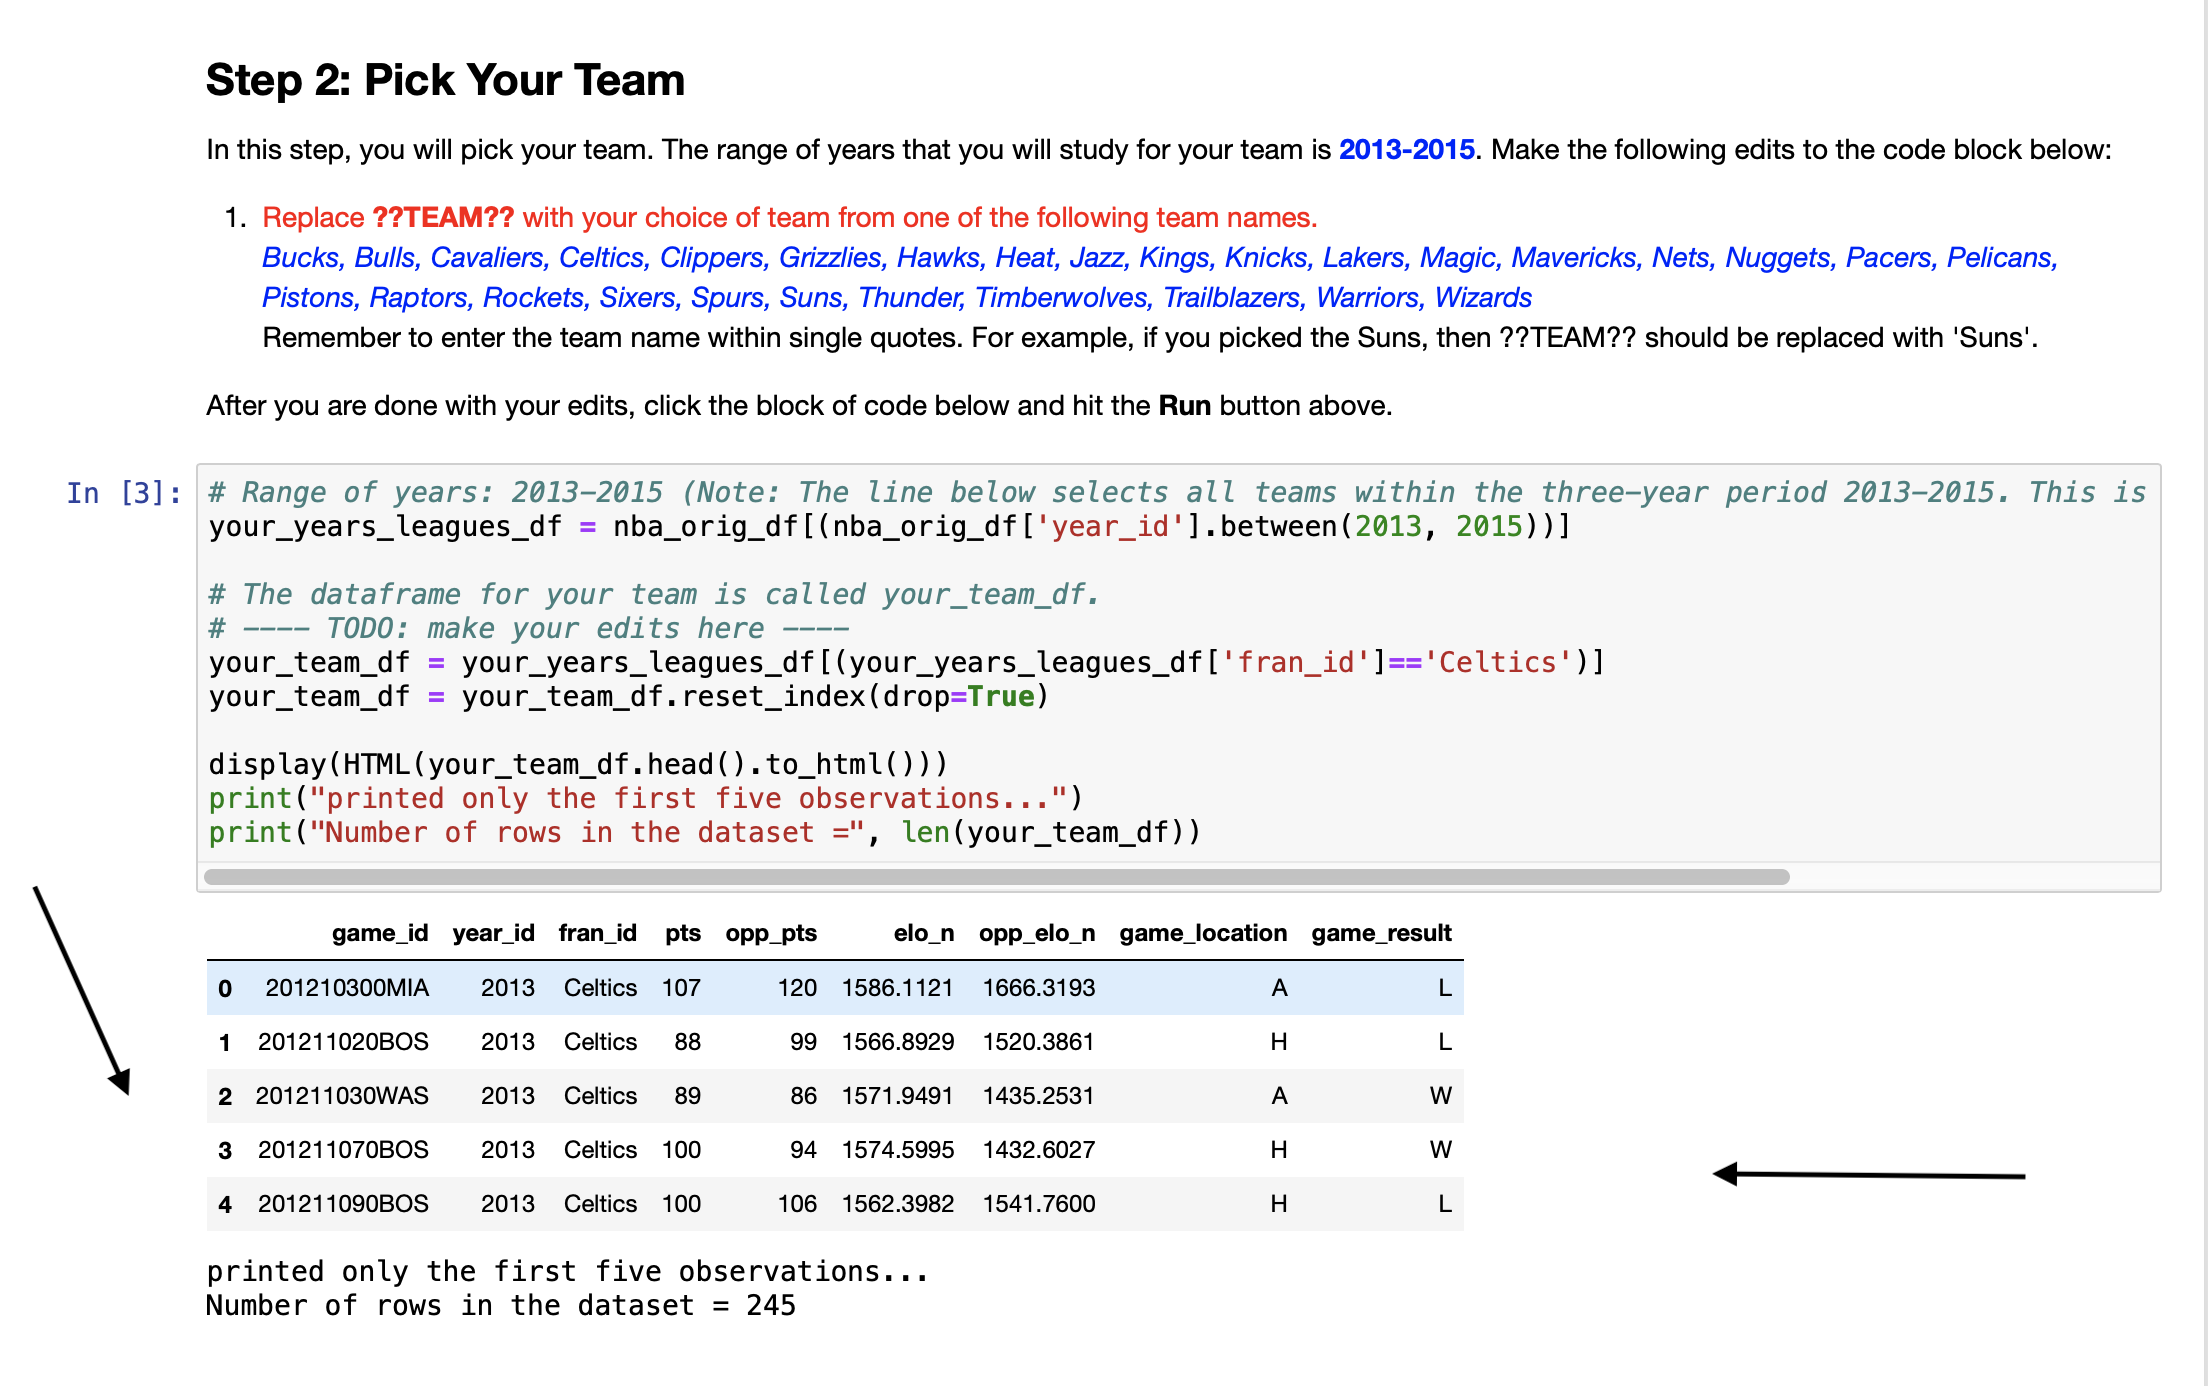
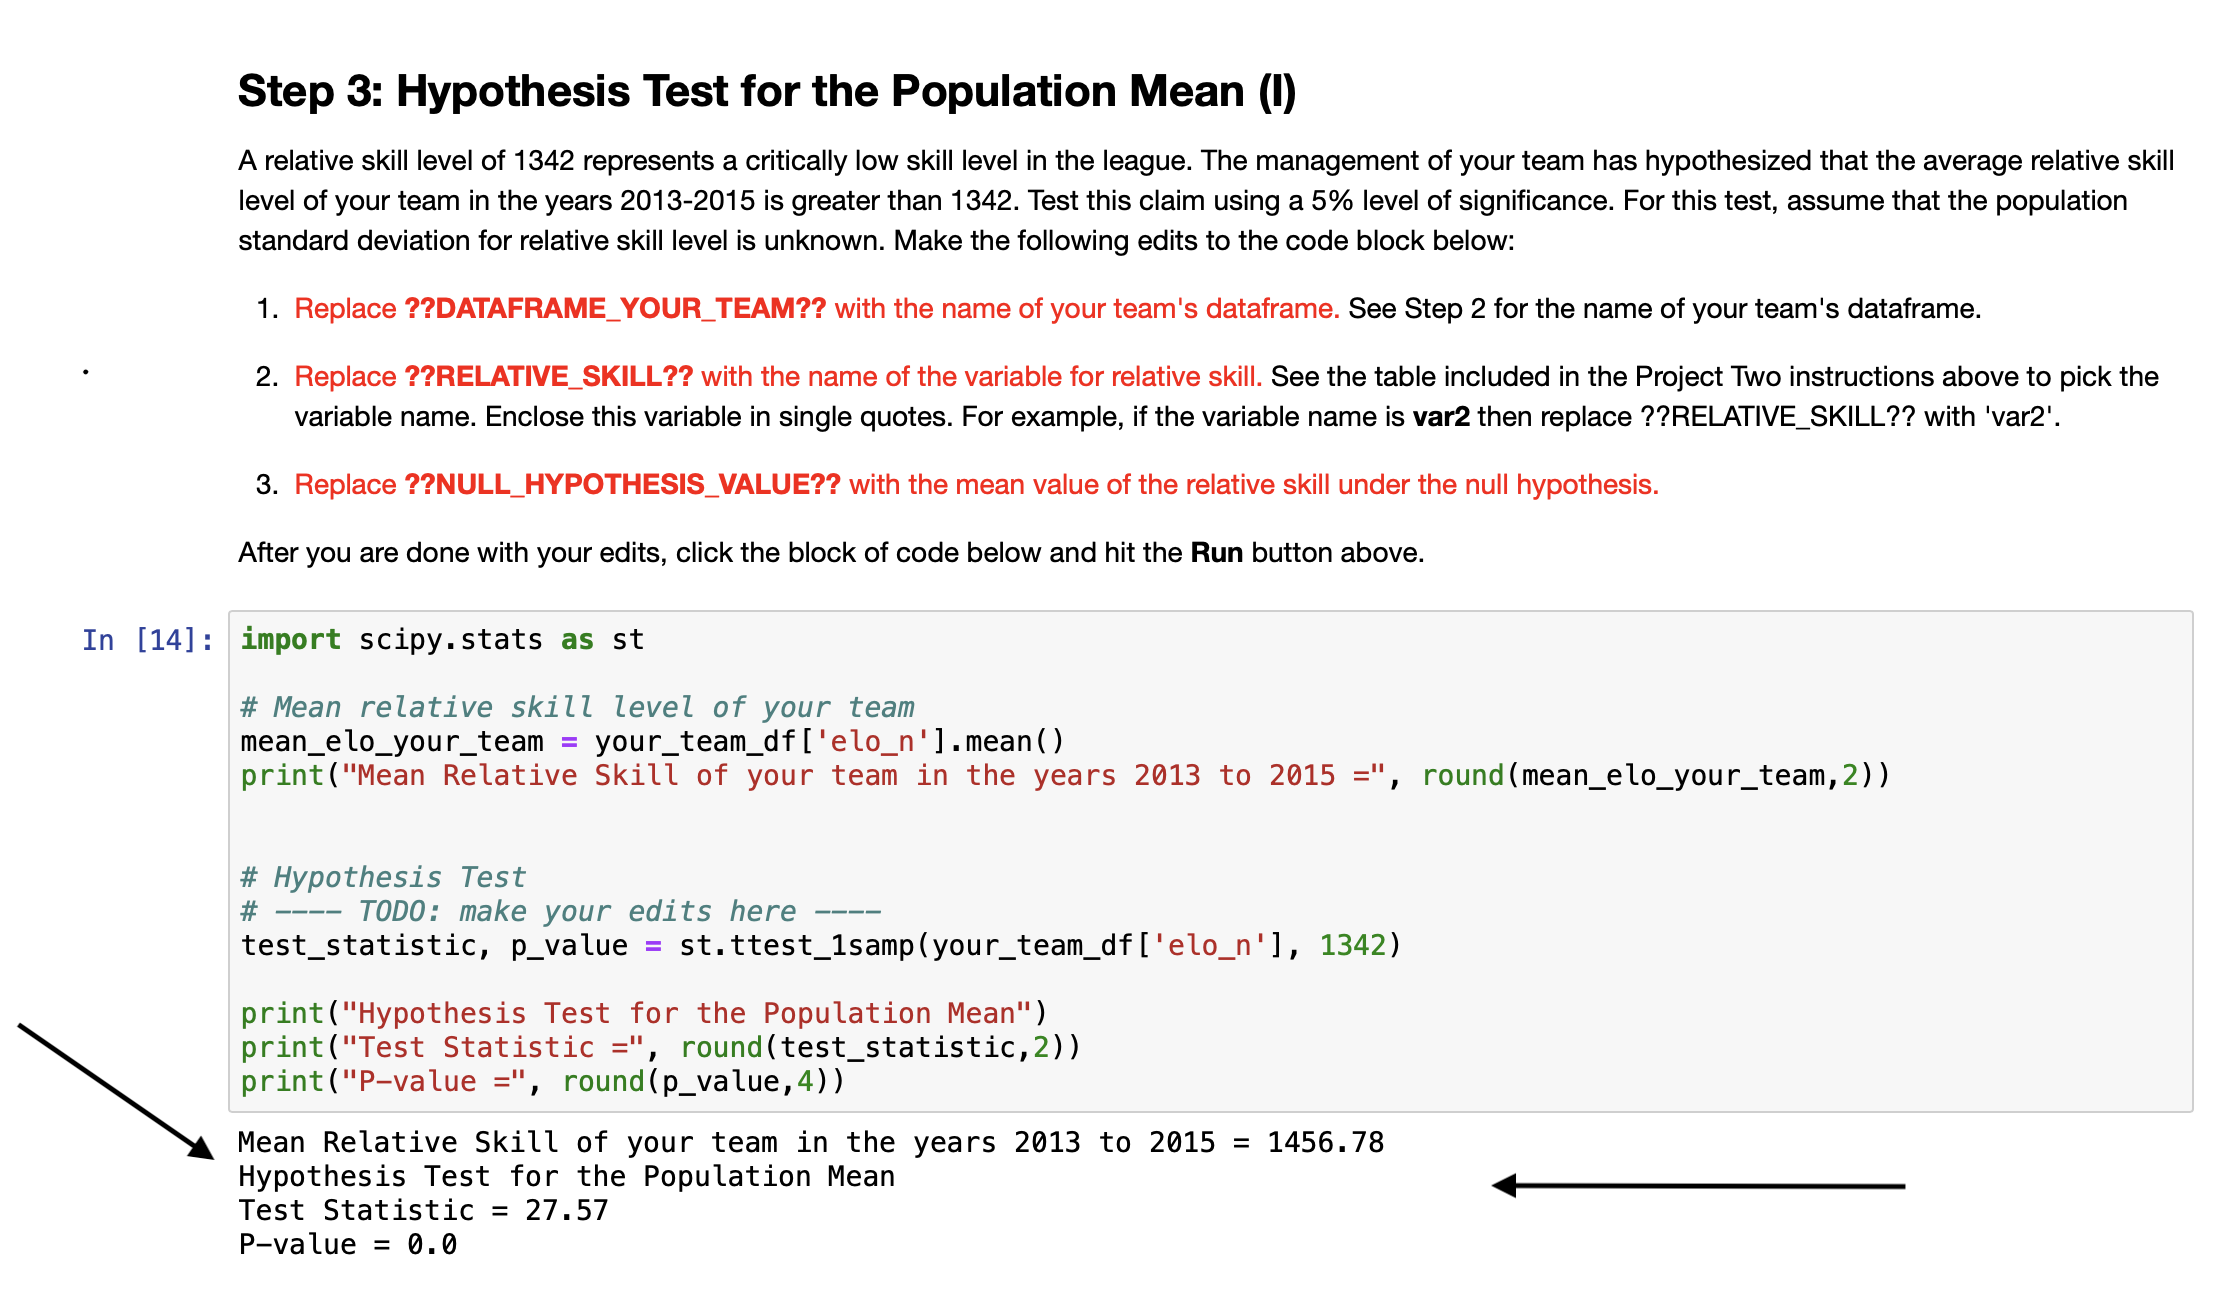
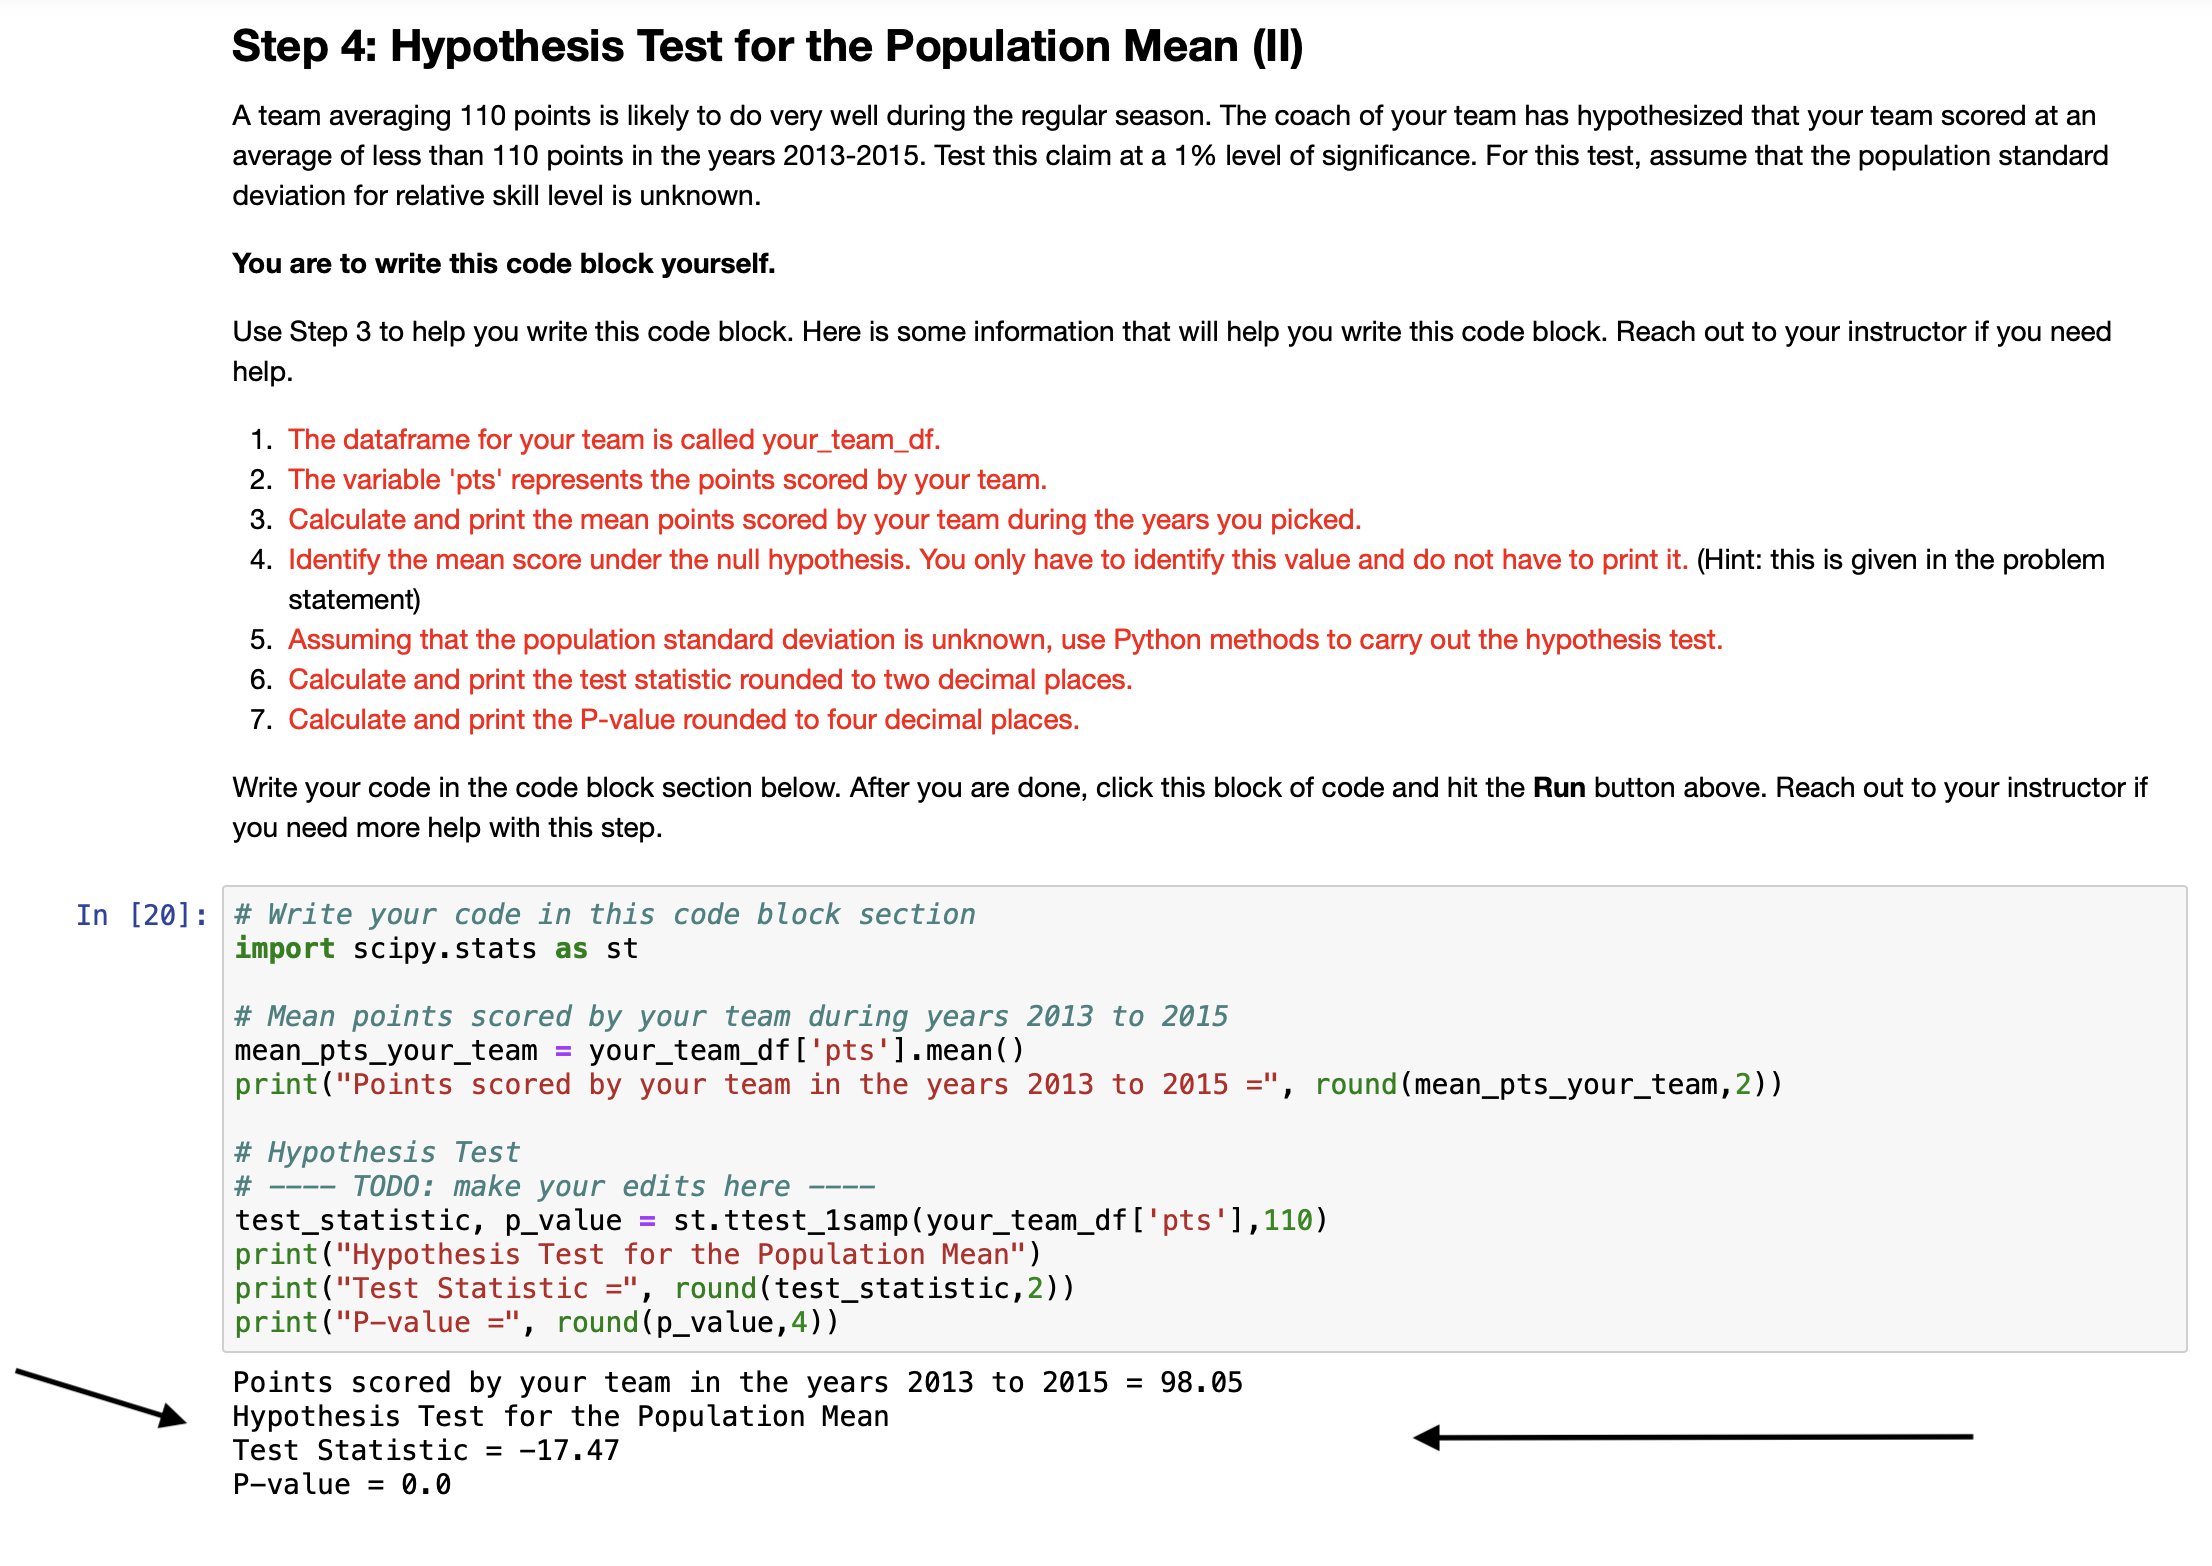
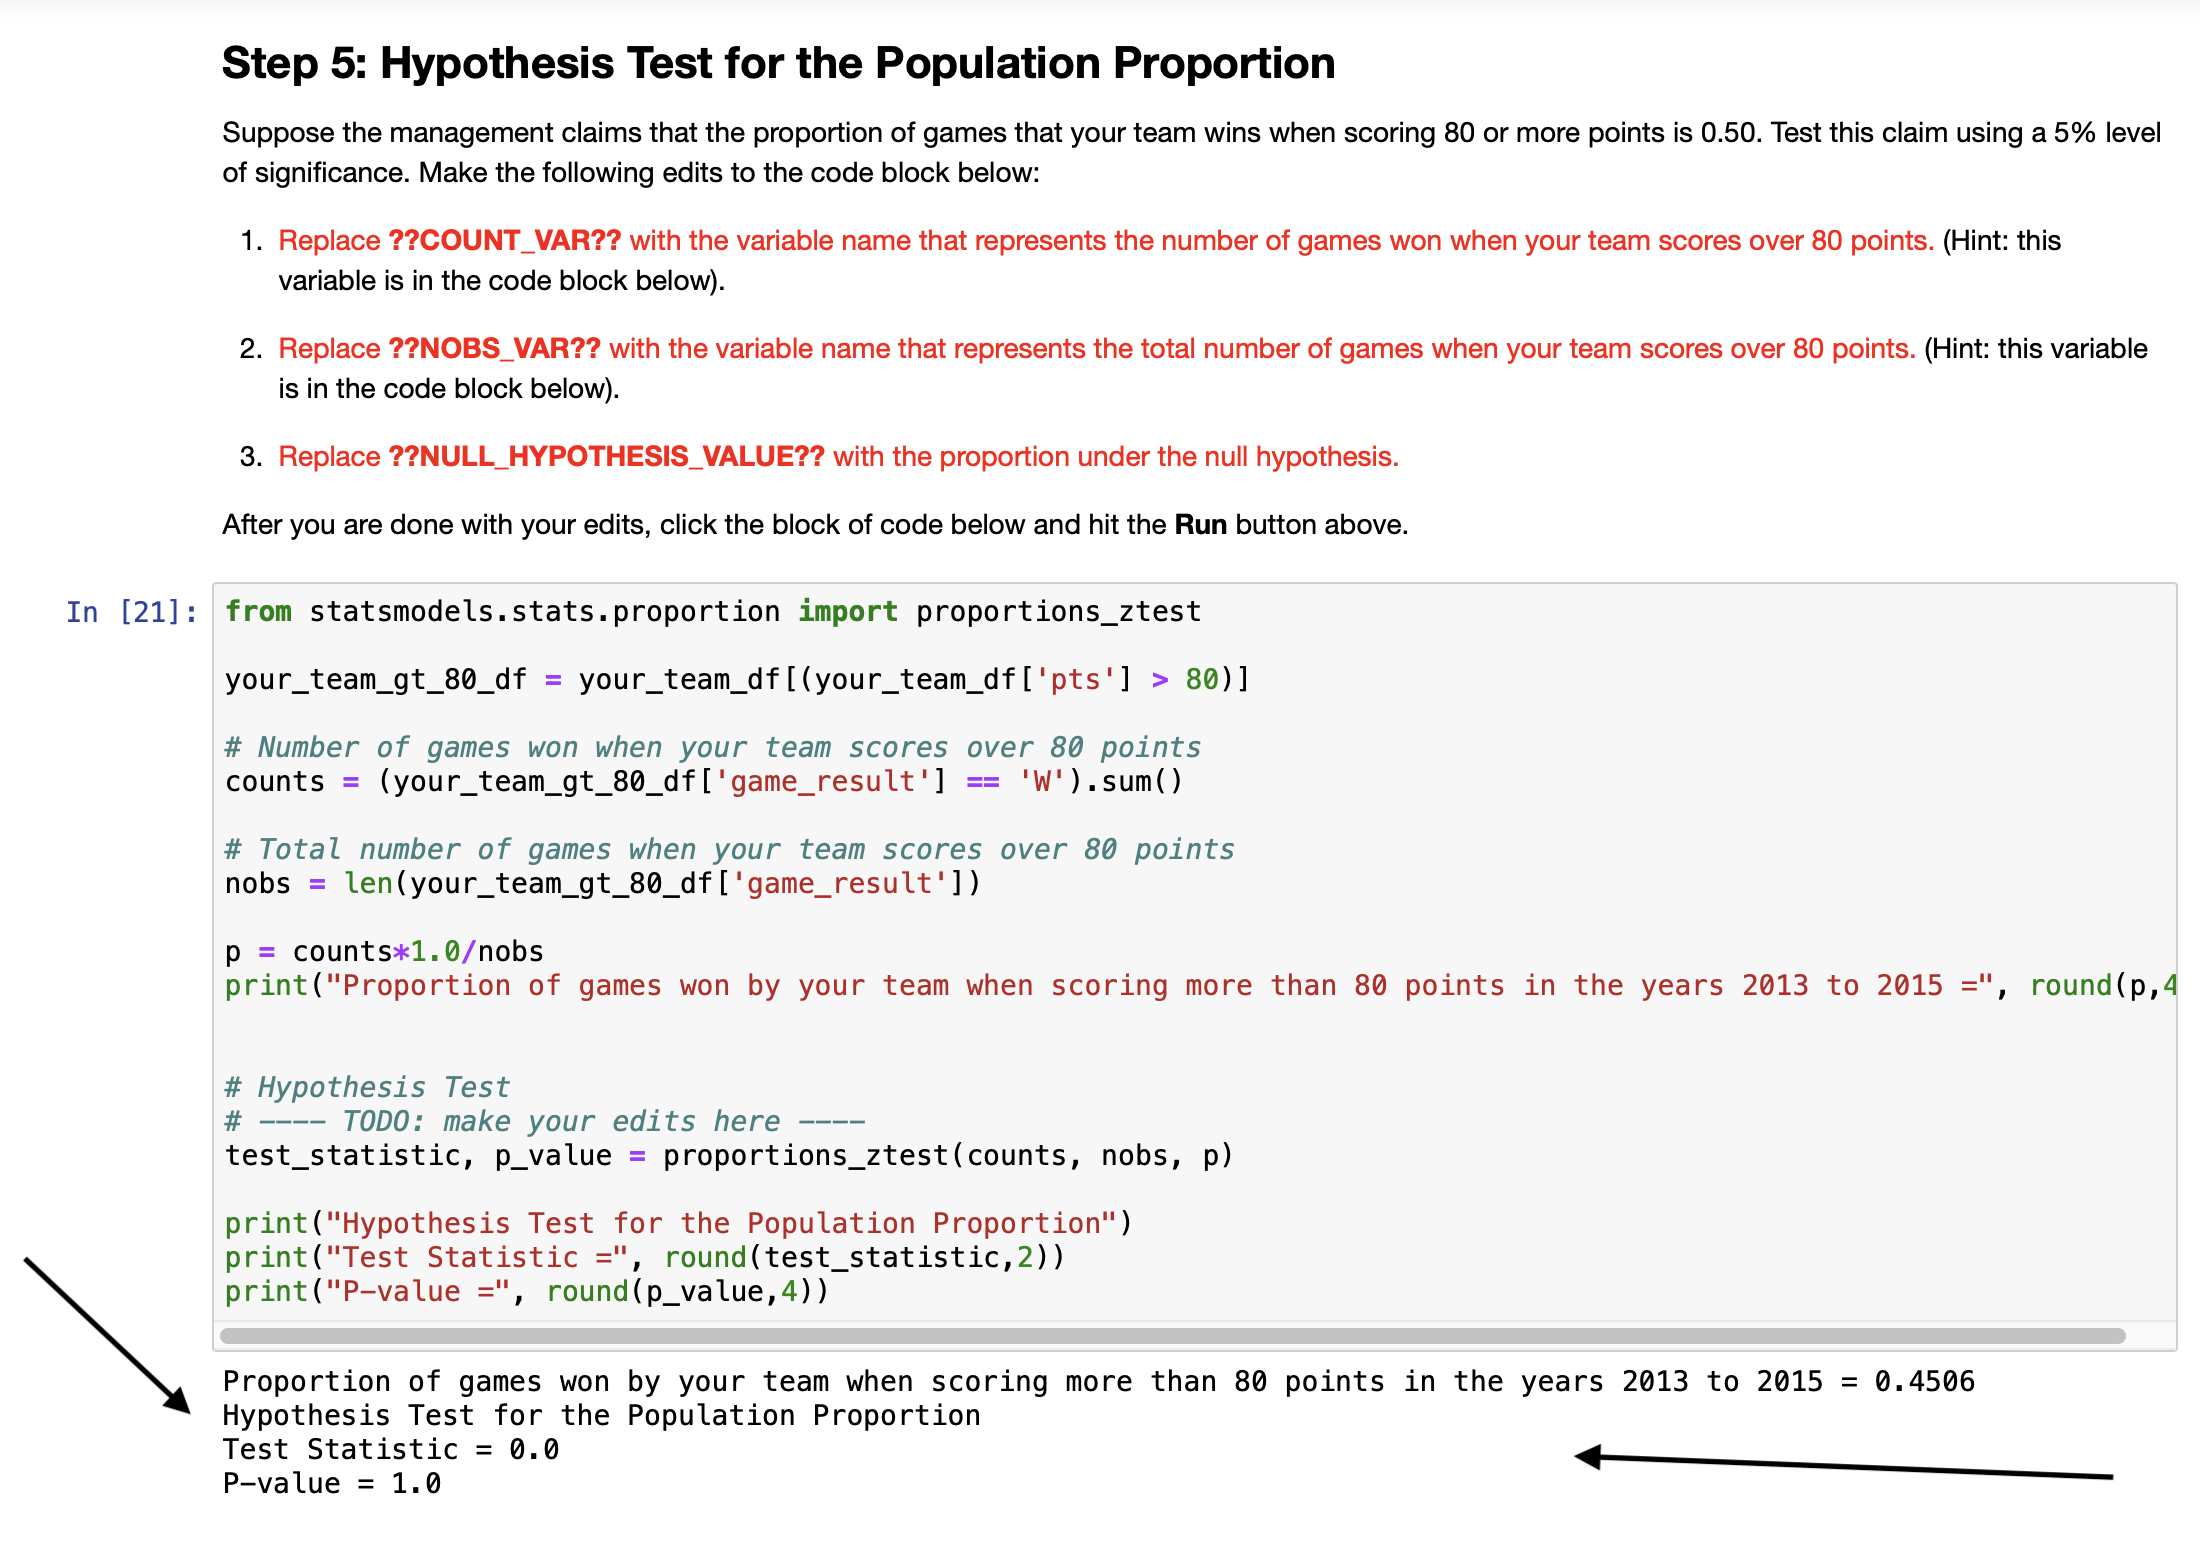
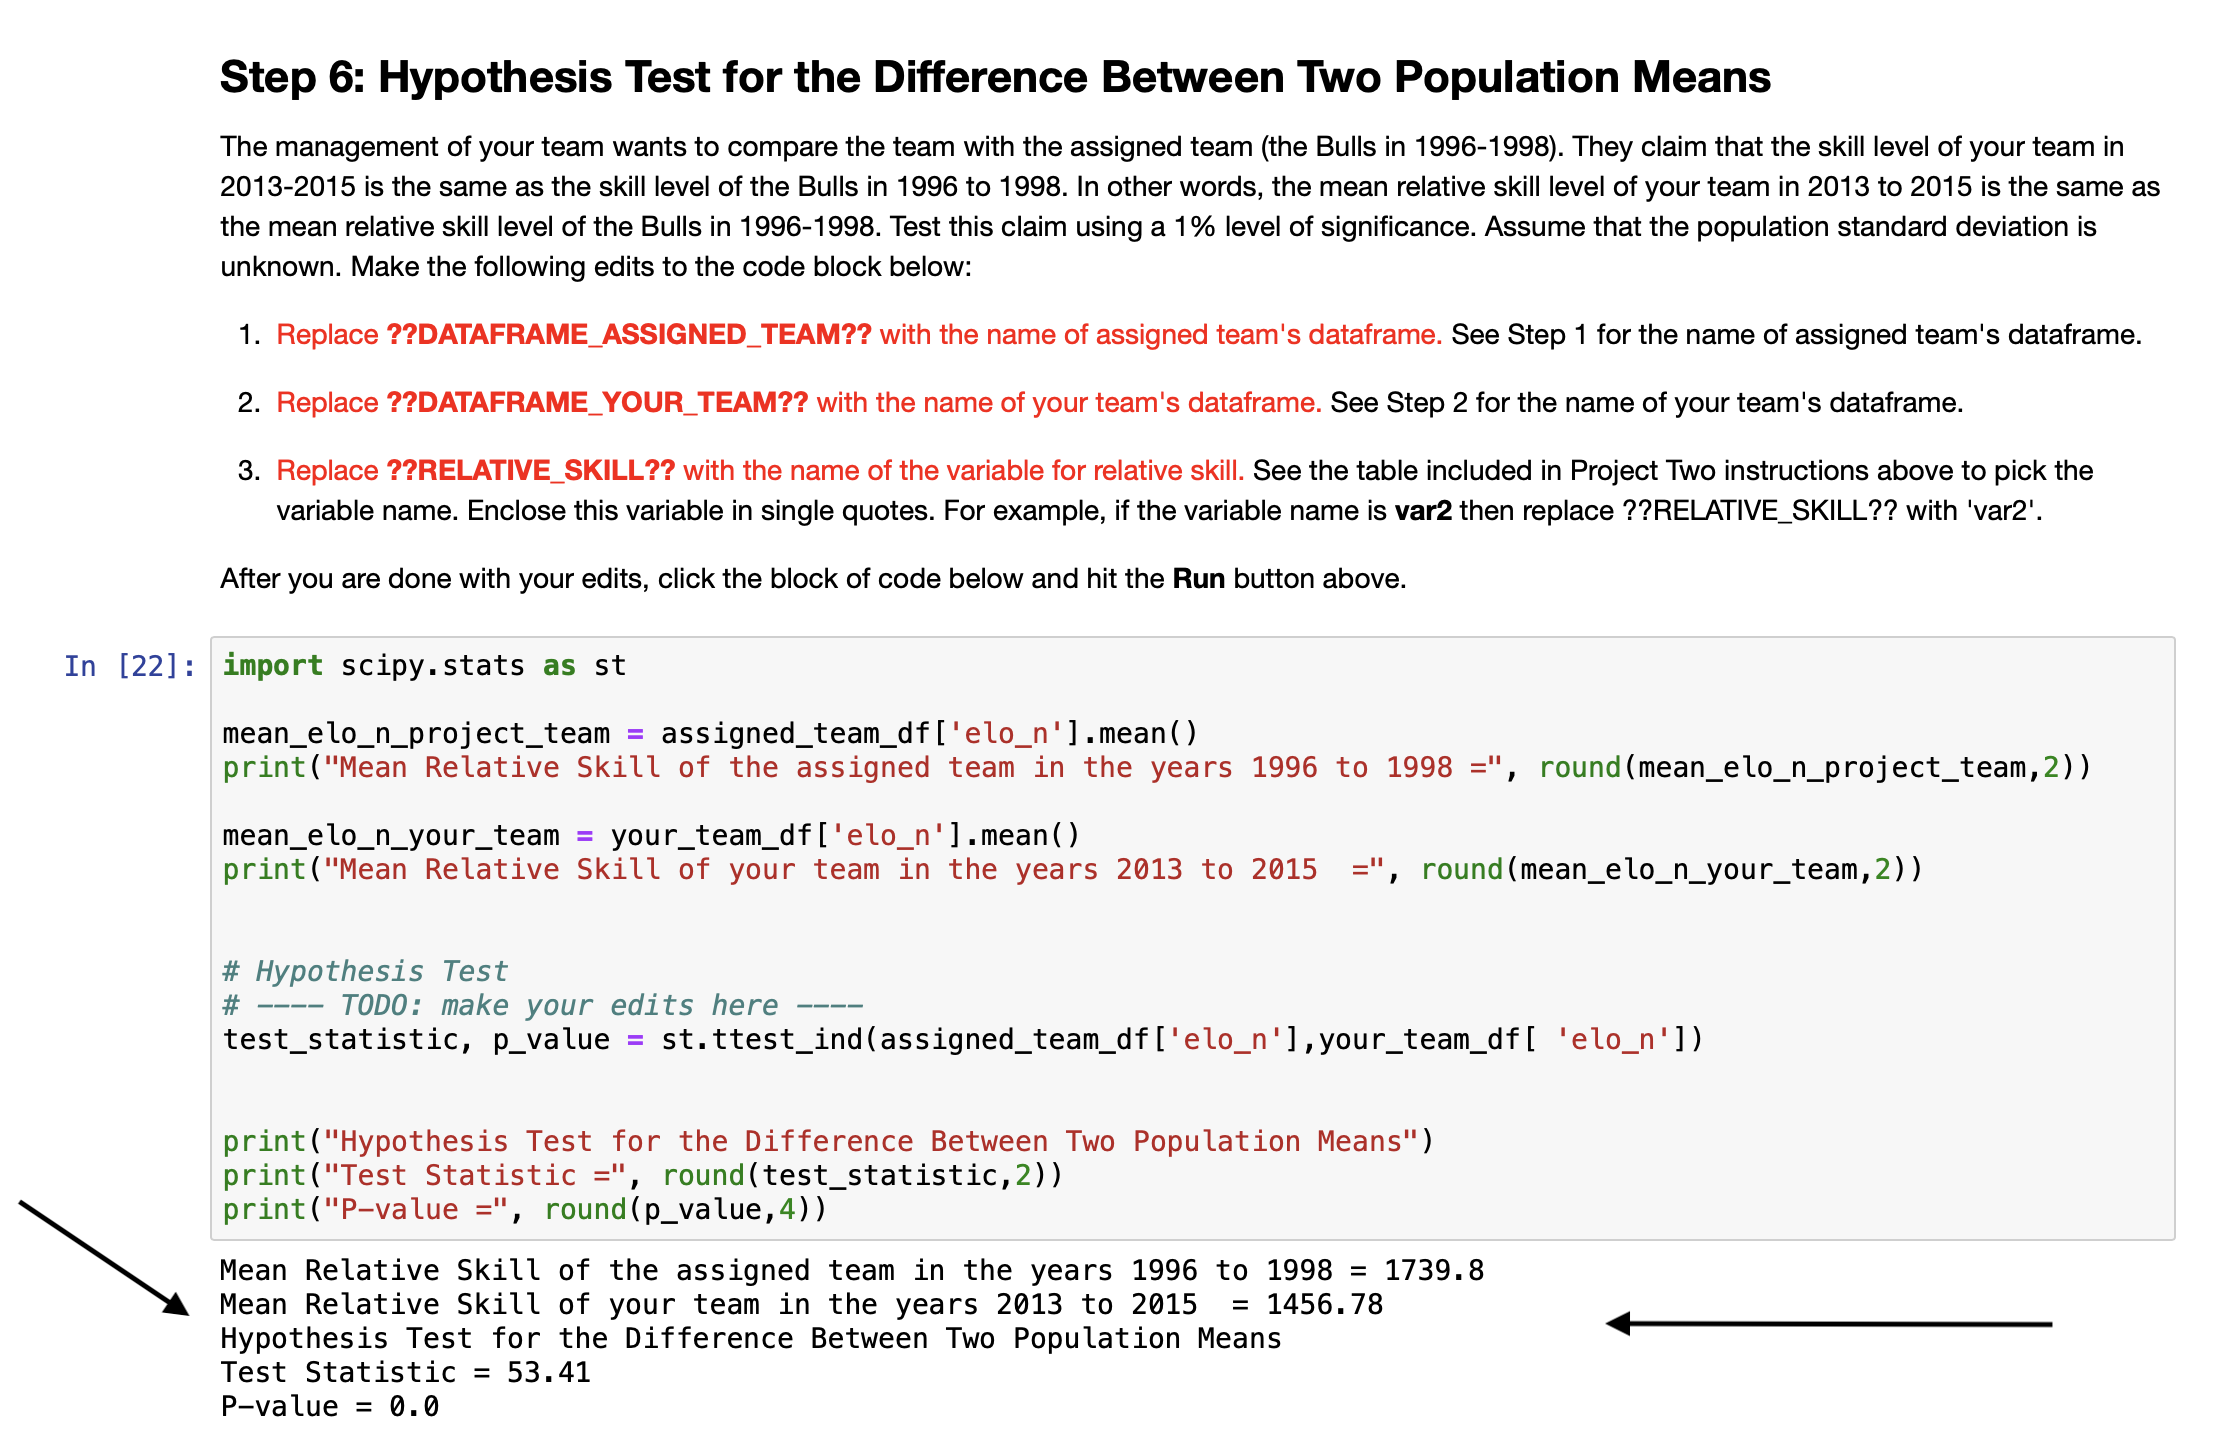
Step 1: Data Preparation & the Assigned Team This step uploads the data set from a CSV file. It also selects the Assigned Team for this analysis. Do not make any changes to the code block below. 1. The Assigned Team is Chicago Bulls from the years 1996 - 1998 Click the block of code below and hit the Run button above. In [1] : import numpy as np import pandas as pd import scipy . stats as st import matplotlib. pyplot as plt from IPython. display import display, HTML nba_orig_df = pd. read_csv( 'nbaallelo. csv' ) nba_orig_df = nba_orig_df [(nba_orig_df [' lg_id' ]=='NBA' ) & (nba_orig_df [' is_playoffs' ]==0) ] columns_to_keep = ['game_id' , 'year_id', 'fran_id' , 'pts', 'opp_pts', 'elo_n', 'opp_elo_n', 'game_location', 'game_result' nba_orig_df = nba_orig_df [columns_to_keep] # The dataframe for the assigned team is called assigned_team_df. # The assigned team is the Bulls from 1996-1998. assigned_years_league_df = nba_orig_df [(nba_orig_df ['year_id' ] . between (1996, 1998) ) ] assigned_team_df = assigned_years_league_df [ (assigned_years_league_df [' fran_id ' ]== 'Bulls' ) ] assigned_team_df = assigned_team_df . reset_index(drop=True) display (HTML (assigned_team_df . head ( ) . to_html() ) ) print ("printed only the first five observations. ..") print ("Number of rows in the dataset =", len(assigned_team_df) ) game_id year_id fran_id pts opp_pts elo_n opp_elo_n game_location game_result 0 199511030CH 1996 Bulls 105 91 1598.2924 1531.7449 H W 1 199511040CHI 1996 Bulls 107 1604.3940 1458.6415 H W 2 199511070CHI 1996 Bulls 1 1605.7983 1310.9349 H W 3 199511090CLE 1996 Bulls 106 88 1618.8701 1452.8268 A W 4 199511110CHI 1996 Bulls 110 106 1621.1591 1490.2861 H W printed only the first five observations. .. Number of rows in the dataset = 246Step 2: Pick Your Team In this step, you will pick your team. The range of years that you will study for your team is 2013-2015. Make the following edits to the code block below: 1. Replace ??TEAM?? with your choice of team from one of the following team names. Bucks, Bulls, Cavaliers, Celtics, Clippers, Grizzlies, Hawks, Heat, Jazz, Kings, Knicks, Lakers, Magic, Mavericks, Nets, Nuggets, Pacers, Pelicans, Pistons, Raptors, Rockets, Sixers, Spurs, Suns, Thunder, Timberwolves, Trailblazers, Warriors, Wizards Remember to enter the team name within single quotes. For example, if you picked the Suns, then ??TEAM?? should be replaced with 'Suns'. After you are done with your edits, click the block of code below and hit the Run button above. In [3] : # Range of years: 2013-2015 (Note: The line below selects all teams within the three-year period 2013-2015. This is your_years_leagues_df = nba_orig_df [ (nba_orig_df ['year_id' ] . between (2013, 2015) ) ] # The dataframe for your team is called your_team_df. # - TODO: make your edits here your_team_df = your_years_leagues_df [ (your_years_leagues_df [ ' fran_id' ]== 'Celtics' ) ] your_team_df = your_team_df. reset_index (drop=True) display (HTML (your_team_df . head( ) . to_html( ) ) ) print ("printed only the first five observations...") print ("Number of rows in the dataset =", len(your_team_df) ) game_id year_id fran_id pts opp_pts elo_n opp_elo_n game_location game_result 0 201210300MIA 2013 Celtics 107 120 1586.1121 1666.3193 A 1 201211020BOS 2013 Celtics 88 99 1566.8929 1520.3861 H L 2 201211030WAS 2013 Celtics 89 86 1571.9491 1435.2531 A W 3 201211070BOS 2013 Celtics 100 94 1574.5995 1432.6027 H W 4 201211090BOS 2013 Celtics 100 106 1562.3982 1541.7600 H L printed only the first five observations. .. Number of rows in the dataset = 245Step 3: Hypothesis Test for the Population Mean (I) A relative skill level of 1342 represents a critically low skill level in the league. The management of your team has hypothesized that the average relative skill level of your team in the years 2013-2015 is greater than 1342. Test this claim using a 5% level of significance. For this test, assume that the population standard deviation for relative skill level is unknown. Make the following edits to the code block below: 1. Replace ??DATAFRAME_YOUR_TEAM?? with the name of your team's dataframe. See Step 2 for the name of your team's dataframe. 2. Replace ??RELATIVE_SKILL?? with the name of the variable for relative skill. See the table included in the Project Two instructions above to pick the variable name. Enclose this variable in single quotes. For example, if the variable name is var2 then replace ??RELAT|VE_SK|LL?? with Ivar2'. 3. Replace ??NULL_HYPOTHESIS_VALUE?? with the mean value of the relative skill under the null hypothesis. After you are done with your edits, click the block of code below and hit the Run button above. In [14]: import scipy.stats as st # Mean relative skill level of your team mean_elo_your_team = your_team_df['elo_n'].mean() print(\"Mean Relative Skill of your team in the years 2013 to 2015 =", round(mean_elo_your_team,2)) # Hypothesis Test # T000: make your edits here test_statistic, p_value = st.ttest_1samp(your_team_df['elo_n'], 1342) print("Hypothesis Test for the Population Mean") print("Test Statistic =\In [20]: Step 4: Hypothesis Test for the Population Mean (II) A team averaging 110 points is likely to do very well during the regular season. The coach of your team has hypothesized that your team scored at an average of less than 110 points in the years 2013-2015. Test this claim at a 1% level of significance. For this test, assume that the population standard deviation for relative skill level is unknown. You are to write this code block yourself. Use Step 3 to help you write this code block. Here is some information that will help you write this code block. Reach out to your instructor if you need help. 1 . 2 3. 4 5. 6. 7. The dataframe for your team is called your_team_df. . The variable 'pts' represents the points scored by your team. Calculate and print the mean points scored by your team during the years you picked. . Identify the mean score under the null hypothesis. You only have to identify this value and do not have to print it. (Hint: this is given in the problem statement) Assuming that the population standard deviation is unknown, use Python methods to carry out the hypothesis test. Calculate and print the test statistic rounded to two decimal places. Calculate and print the Pvalue rounded to four decimal places. Write your code in the code block section below. After you are done, click this block of code and hit the Run button above. Reach out to your instructor if you need more help with this step. # Write your code in this code block section import scipy.stats as st # Mean points scored by your team during years 2013 to 2015 mean_pts_your_team = your_team_df [ 'pts ' ] .mean() print("Points scored by your team in the years 2013 to 2015 =", round(mean_pts_your_team,2)) # Hypothesis Tbst # ---- TODD: make your edits here ---- test_statistic, p_value = st.ttest_15amp(your_team_df['pts'],110) print("Hypothesis Test for the Population Mean") print("Test Statistic =", round(test_statistic,2)) print("Pvalue =", round(p_va1ue,4)) Points scored by your team in the years 2013 to 2015 = 98.05 Hypothesis Test for the Population Mean Test Statistic = -17.47 ' Pvalue = 0.0 In [21]: Step 5: Hypothesis Test for the Population Proportion Suppose the management claims that the proportion of games that your team wins when scoring 80 or more points is 0.50. Test this claim using a 5% level of significance. Make the following edits to the code block below: 1. Replace ??COUNT_VAR?? with the variable name that represents the number of games won when your team scores over 80 points. (Hint: this variable is in the code block below). 2. Replace ??NOBS_VAR?? with the variable name that represents the total number of games when your team scores over 80 points. (Hint: this variable is in the code block below). 3. Replace ??NULL_HYPOTHESIS_VALU E?? with the proportion under the null hypothesis. After you are done with your edits, click the block of code below and hit the Run button above. from statsmodels.stats.proportion import proportions_ztest your_team_gt_80_df = your_team_df[(your_team_df['pts'] > 80)] # Number of games won when your team scores over 80 points counts = (your_team_gt_80_df['game_resutt'] == 'W').sum() # Total number of games when your team scores over 80 points nobs = 1en(your_team_gt_80_df [ 'game_resutt' ]) p = counts*1.0obs print("Proportion of games won by your team when scoring more than 80 points in the years 2013 to 2015 =", round(p,4 # Hypothesis Test # ---- TODD: make your edits here ---- test_statistic, p_value = proportions_ztest(counts, nobs, p) print("Hypothesis Test for the Population Proportion") print("Test Statistic =", round(test_statistic,2)) print("Pvatue =", round(p_val.ue,4)) Proportion of games won by your team when scoring more than 80 points in the years 2013 to 2015 = 0.4506 Hypothesis Test for the Population Proportion Test Statistic = 0.0 '_\\ P-vatue = 1.0 In [22]: Step 6: Hypothesis Test for the Difference Between Two Population Means The management of your team wants to compare the team with the assigned team (the Bulls in 1996-1998). They claim that the skill level of your team in 2013-2015 is the same as the skill level of the Bulls in 1996 to 1998. In other words, the mean relative skill level of your team in 2013 to 2015 is the same as the mean relative skill level of the Bulls in 1996-1998. Test this claim using a 1% level of significance. Assume that the population standard deviation is unknown. Make the following edits to the code block below: 1. Replace ??DATAFRAME_ASSIGNED_TEAM?? with the name of assigned team's dataframe. See Step 1 for the name of assigned team's dataframe. 2. Replace ??DATAFRAME_YOUR_TEAM?? with the name of your team's dataframe. See Step 2 for the name of your team's dataframe. 3. Replace ??RELATIVE_SKILL?? with the name of the variable for relative skill. See the table included in Project Two instructions above to pick the variable name. Enclose this variable in single quotes. For example, if the variable name is var2 then replace ??RELAT|VE_SK|LL?? with 'var2'. After you are done with your edits, click the block of code below and hit the Run button above. import scipy.stats as st mean_elo_n_project_team = assigned_team_df['elo_n'].mean() print("Mean Relative Skill of the assigned team in the years 1996 to 1998 =\
Step by Step Solution
There are 3 Steps involved in it

Get step-by-step solutions from verified subject matter experts