Question: please type the answer Problem 2- (30 Points)-Solve Problem 20 of the Textbook, Page 146, using the C- Chart, also explain the data feature that

 please type the answer
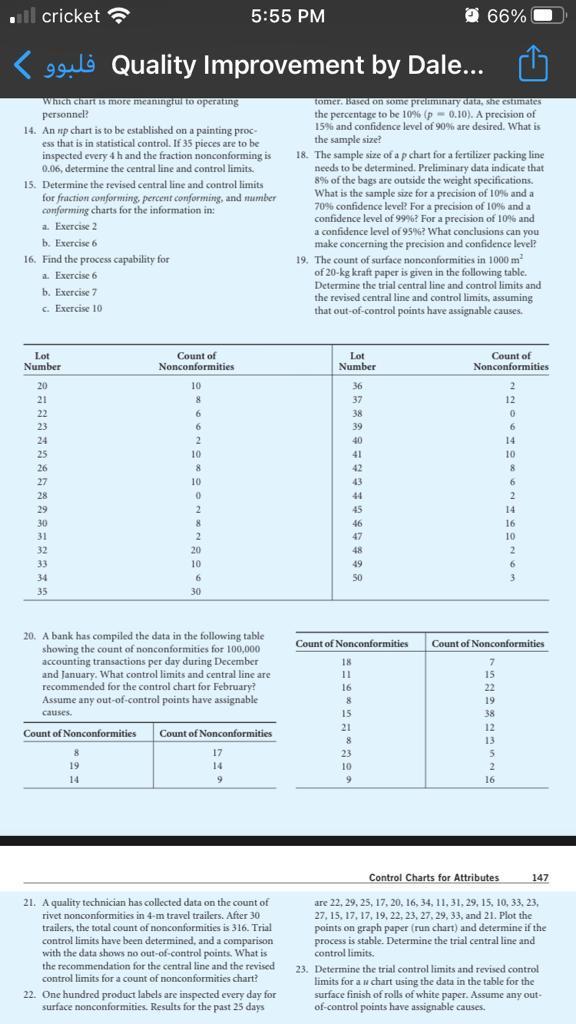
Problem 2- (30 Points)-Solve Problem 20 of the Textbook, Page 146, using the C- Chart, also explain the data feature that made it possible to use the C-Chart in this case. il cricket 5:55 PM 66% guls Quality Improvement by Dale... Which chart is more meaningful to operating personnel? 14. An ap chart is to be established on a painting proc ess that is in statistical control. If 35 pieces are to be inspected every 4 h and the fraction nonconforming is 0.06, determine the central line and control limits. 15. Determine the revised central line and control limits for fraction conforming, percent conforming, and mumber conforming charts for the information in: a. Exercise 2 tomer. Based on some preliminary data, she estimates the percentage to be 10% (p=0.10). A precision of 15% and confidence level of 90% are desired. What is the sample size? 18. The sample size of a p chart for a fertilizer packing line needs to be determined. Preliminary data indicate that 8% of the bags are outside the weight specifications What is the sample size for a precision of 10% and a 70% confidence level? For a precision of 10% and a confidence level of 99%? For a precision of 10% and a confidence level of 95%? What conclusions can you make concerning the precision and confidence level? 19. The count of surface nonconformities in 1000 m of 20-kg kraft paper is given in the following tablc. Determine the trial central line and control limits and the revised central line and control limits, assuming that out-of-control points have assignable causes. b. Exercise 6 16. Find the process capability for a. Exercise 6 b. Exercise 7 c. Exercise 10 Lot Number Count of Nonconformities Lot Number Count of Nonconformities 36 12 0 20 21 22 23 24 25 26 27 28 29 30 31 32 33 34 35 10 8 6 6 2 10 8 10 0 2 8 2 20 10 6 6 30 37 38 39 40 41 42 43 44 45 46 47 6 14 10 8 6 2 14 16 10 2 6 3 48 49 SO Count of Nonconformities 20. A bank has compiled the data in the following table showing the count of nonconformities for 100,000 accounting transactions per day during December and January. What control limits and central line are recommended for the control chart for February? Assume any out-of-control points have assignable causes. Count of Nonconformities Count of Nonconformities 8 17 19 14 14 9 Count of Nonconformities 18 11 16 8 15 21 8 23 10 9 7 15 22 19 38 12 13 5 2 16 Control Charts for Attributes 147 21. A quality technician has collected data on the count of rivet nonconformities in 4-m travel trailers. After 30 trailers, the total count of nonconformities is 316. Trial control limits have been determined, and a comparison with the data shows no out-of-control points. What is the recommendation for the central line and the revised control limits for a count of nonconformities chart? 22. One hundred product labels are inspected every day for surface nonconformities. Results for the past 25 days are 22, 29,25, 17, 20, 16, 34, 11, 31.29, 15, 10, 33, 23, 27, 15, 17, 17, 19, 22, 23, 27, 29, 33, and 21. Plot the points on graph paper (run chart) and determine if the process is stable. Determine the trial central line and control limits. 23. Determine the trial control limits and revised control limits for a chart using the data in the table for the surface finish of rolls of white paper. Assume any out- of-control points have assignable causes


