

Question: PLEASE TYPE THE SCRIPT AND FUNCTIONS AND FOLLOW THE INSTRUCTIONS ALL THE INFORMATION THAT YOU NEED ARE POSTED figure 1 figure 2 figure 3 figure
PLEASE TYPE THE SCRIPT AND FUNCTIONS AND FOLLOW THE INSTRUCTIONS
ALL THE INFORMATION THAT YOU NEED ARE POSTED
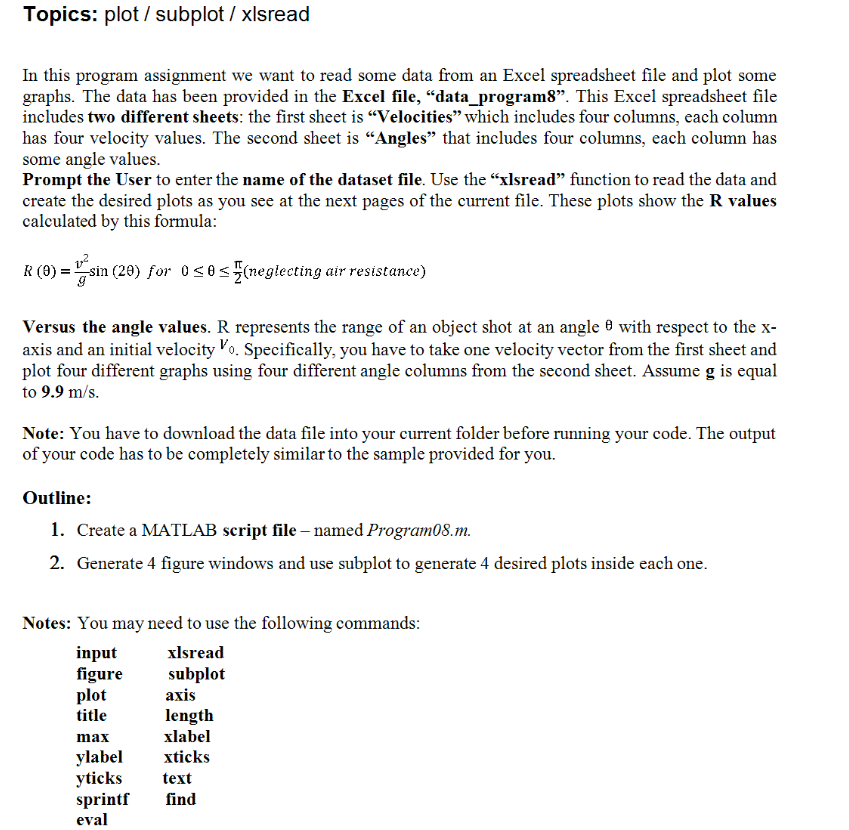
figure 1
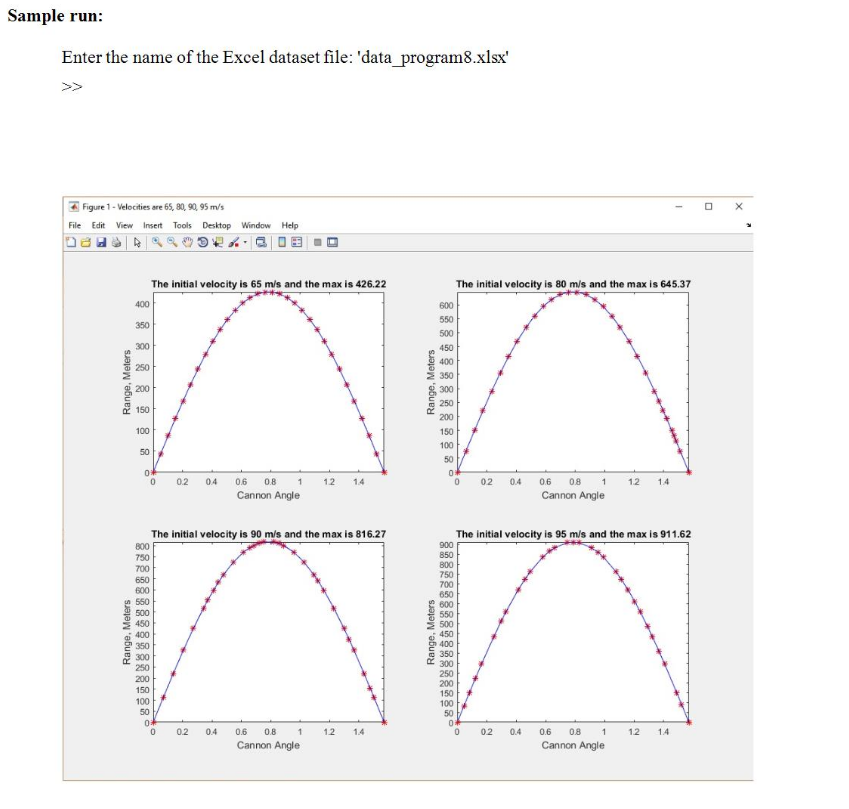
figure 2
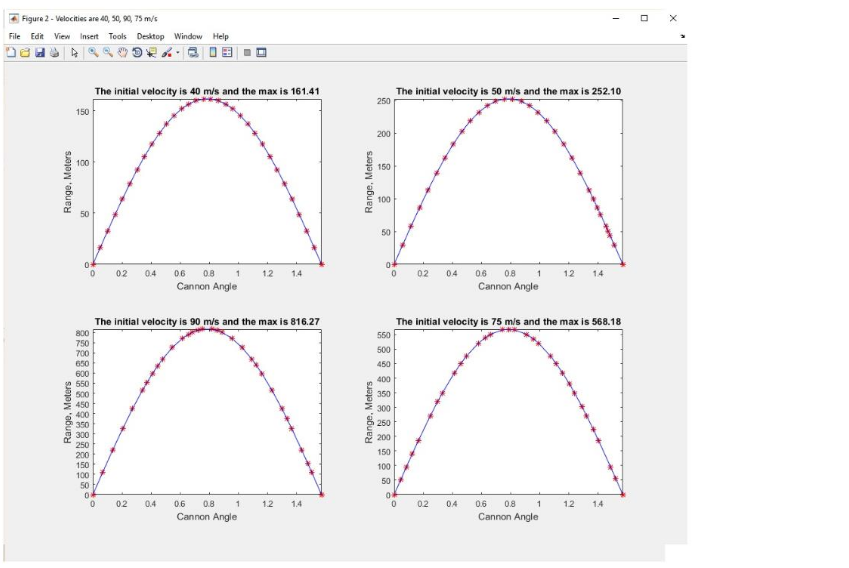
figure 3
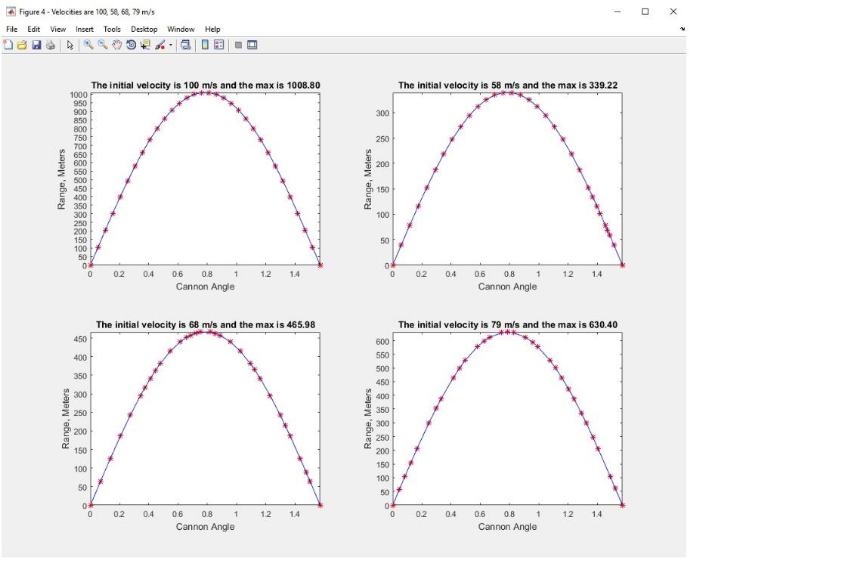
figure 4
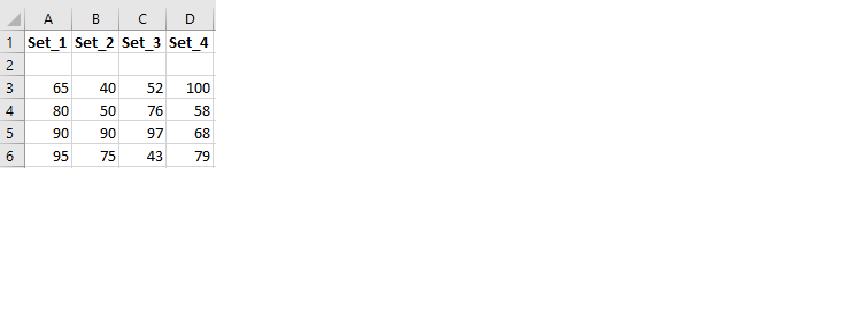
Program08data-Velocities
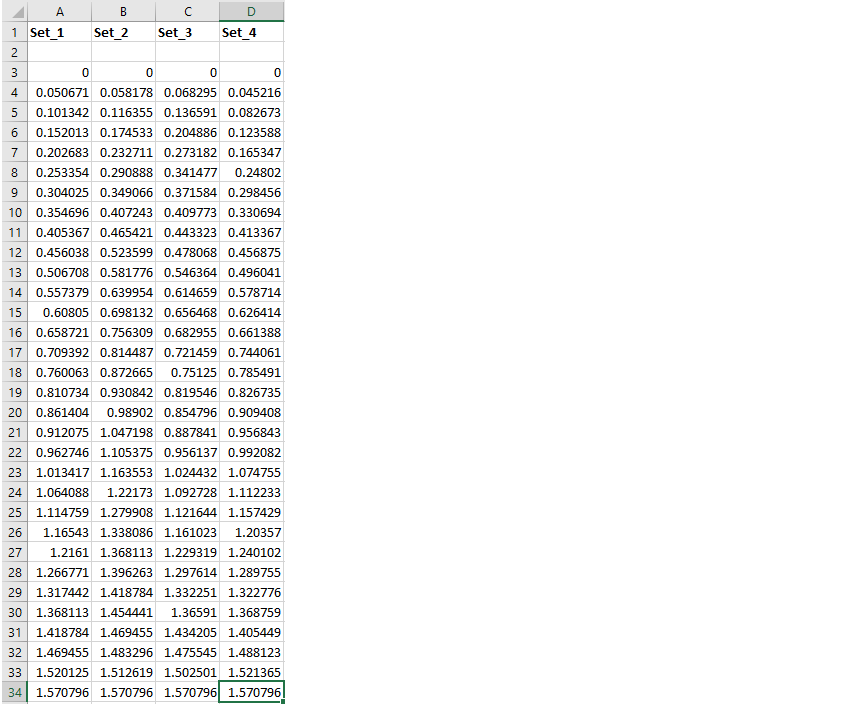
Program08data-Angles
FOR FIGURES: title, x-axis, and y-axis information is required
FUGUES MUST MATCH EXACTLY THE SAME FIGURES THAT IN THE QUESTION ( SUCH AS DATA AND LABELS)
THANK YOU
HINT:
prompt the user to enter (input function) the name of the dataset
use_ xlsread to read the data
create the desired graphs
output- 4 figure windows ===>bplot(2,2,0)
Topics: plot / subplot / xlsread In this program assignment we want to read some data from an Excel spreadsheet file and plot some graphs. The data has been provided in the Excel file, "data program8". This Excel spreadsheet file includes two different sheets: the first sheet is "Velocities" which includes four columns, each column has four velocity values. The second sheet is Angles" that includes four columns, each column has some angle values Prompt the User to enter the name of the dataset file. Use the "xlsread" function to read the data and create the desired plots as you see at the next pages of the current file. These plots show the R values calculated by this formula u2 R (9)--sin (29) for 0 (neglecting air resistance) versus the angle values. R represents the range of an object shot at an angle with respect to the x- axis and an initial velocity Vo. Specifically, you have to take one velocity vector from the first sheet and plot four different graphs using four different angle columns from the second sheet. Assume g is equal to 9.9 m/s Note: You have to download the data file into your current folder before running your code. The output of your code has to be completely similar to the sample provided for you. Outline: 1. Create a MATLAB script file named Program08.m. 2. Generate 4 figure windows and use subplot to generate 4 desired plots inside each one Notes: You may need to use the following commands input figure plot title max ylabel yticks sprintf find eval xlsread subplot axis length xlabel xticks text
Step by Step Solution
There are 3 Steps involved in it

Get step-by-step solutions from verified subject matter experts