

Question: Please upload a pdf file that includes the R scripts, abbreviated outputs and answers / explanations to the questions. In this problem we will perform
Please upload a pdf file that includes the scripts, abbreviated outputs and
answersexplanations to the questions.
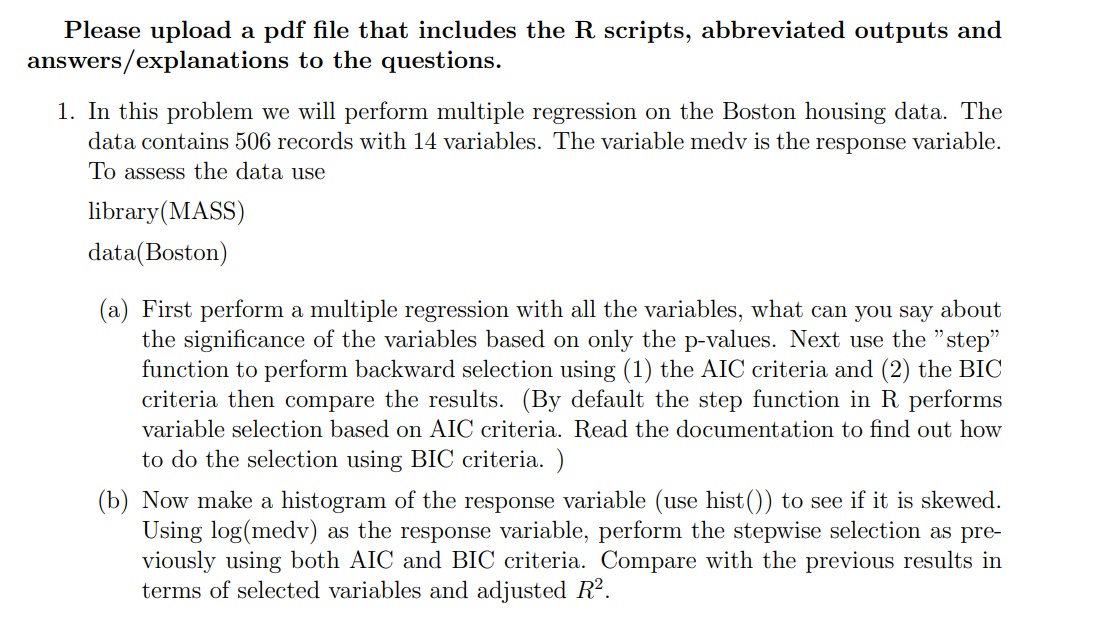
In this problem we will perform multiple regression on the Boston housing data. The
data contains records with variables. The variable medv is the response variable.
To assess the data use
libraryMASS
dataBoston
a First perform a multiple regression with all the variables, what can you say about
the significance of the variables based on only the pvalues. Next use the "step"
function to perform backward selection using the AIC criteria and the BIC
criteria then compare the results. By default the step function in performs
variable selection based on AIC criteria. Read the documentation to find out how
to do the selection using BIC criteria.
b Now make a histogram of the response variable use hist to see if it is skewed.
Using medv
Step by Step Solution
There are 3 Steps involved in it
1 Expert Approved Answer
Step: 1 Unlock

Question Has Been Solved by an Expert!
Get step-by-step solutions from verified subject matter experts
Step: 2 Unlock
Step: 3 Unlock