

Question: Please use 6 step format & show work through minitab!! will thumbs up!! Use the six step process to determine if the proportions are equal.
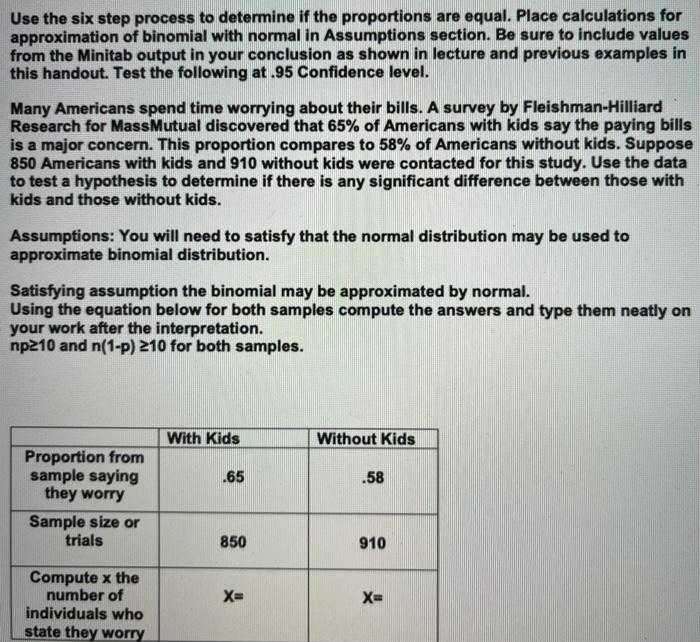
Use the six step process to determine if the proportions are equal. Place calculations for approximation of binomial with normal in Assumptions section. Be sure to include values from the Minitab output in your conclusion as shown in lecture and previous examples in this handout. Test the following at .95 Confidence level. Many Americans spend time worrying about their bills. A survey by Fleishman-Hilliard Research for MassMutual discovered that 65% of Americans with kids say the paying bills is a major concern. This proportion compares to 58% of Americans without kids. Suppose 850 Americans with kids and 910 without kids were contacted for this study. Use the data to test a hypothesis to determine if there is any significant difference between those with kids and those without kids. Assumptions: You will need to satisfy that the normal distribution may be used to approximate binomial distribution. Satisfying assumption the binomial may be approximated by normal. Using the equation below for both samples compute the answers and type them neatly on your work after the interpretation. np210 and n(1-P) 210 for both samples. With Kids Without Kids .65 .58 Proportion from sample saying they worry Sample size or trials 850 910 X- X- Compute x the number of individuals who state they worry Use the six step process to determine if the proportions are equal. Place calculations for approximation of binomial with normal in Assumptions section. Be sure to include values from the Minitab output in your conclusion as shown in lecture and previous examples in this handout. Test the following at .95 Confidence level. Many Americans spend time worrying about their bills. A survey by Fleishman-Hilliard Research for MassMutual discovered that 65% of Americans with kids say the paying bills is a major concern. This proportion compares to 58% of Americans without kids. Suppose 850 Americans with kids and 910 without kids were contacted for this study. Use the data to test a hypothesis to determine if there is any significant difference between those with kids and those without kids. Assumptions: You will need to satisfy that the normal distribution may be used to approximate binomial distribution. Satisfying assumption the binomial may be approximated by normal. Using the equation below for both samples compute the answers and type them neatly on your work after the interpretation. np210 and n(1-P) 210 for both samples. With Kids Without Kids .65 .58 Proportion from sample saying they worry Sample size or trials 850 910 X- X- Compute x the number of individuals who state they worry
Step by Step Solution
There are 3 Steps involved in it

Get step-by-step solutions from verified subject matter experts