

Question: please use excel and explain how to create the charts 5-3. The data shown here are the deviations from nominal diameter for holes drilled in
please use excel and explain how to create the charts 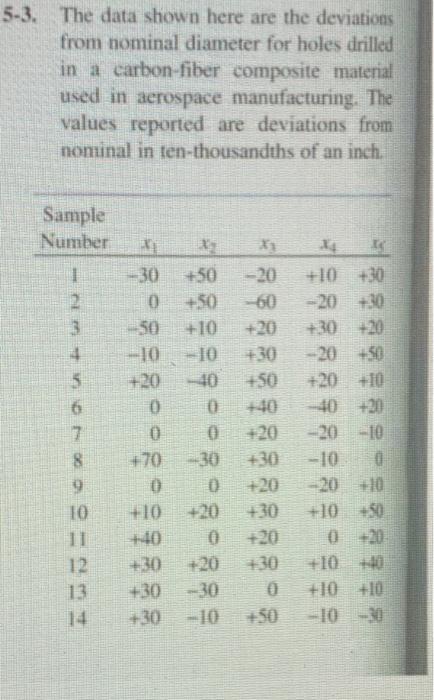
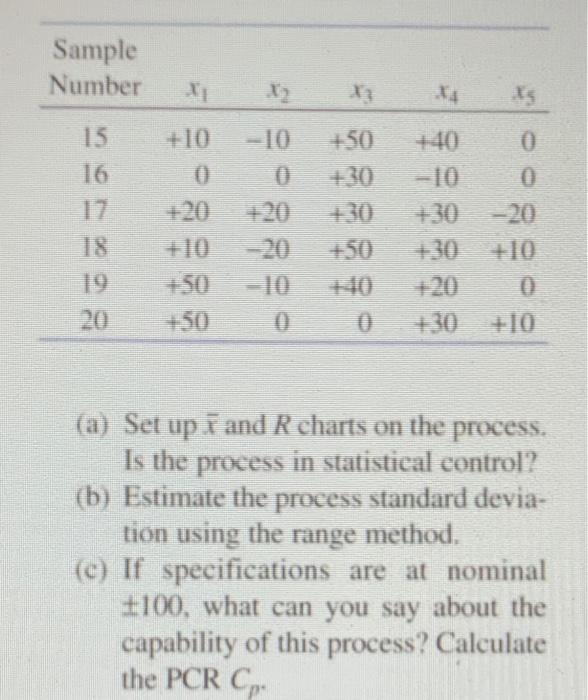
5-3. The data shown here are the deviations from nominal diameter for holes drilled in a carbon-fiber composite material used in aerospace manufacturing. The values reported are deviations from nominal in ten-thousandths of an inch. Sample Number 1 2 3 4 5 0 7. 8 -20 -60 +20 +30 +50 -30 0 -50 10 +20 0 0 +70 D +10 +40 40 +50 +50 +10 10 -40 0 0 30 0 +20 0 +20 -30 -10 +10+30 -- 20 +30 +30+20 -20 - +50 +20 +10 +0+20 -20 1-10 --10 = 20 +20 +10 0 +20 +10 +10 +10 9 +20 +30 +20 +30 +20 +30 0 +50 10 +30 12 13 14 +30 +30 Sample Number X 14 15 15 16 - 10 0 +20 +10 0 +20 +10 +50 +50 +50 + 30 +30 +50 +10 0 +40 0 -10 0 +30 - 20 +30 +10 +20 +30 +10 18 19 20 (a) Set up 7 and R charts on the process. . Is the process in statistical control? (b) Estimate the process standard devia- ( tion using the range method. (c) If specifications are at nominal +100, what can you say about the capability of this process? Calculate the PCR C Step by Step Solution
There are 3 Steps involved in it
1 Expert Approved Answer
Step: 1 Unlock

Question Has Been Solved by an Expert!
Get step-by-step solutions from verified subject matter experts
Step: 2 Unlock
Step: 3 Unlock