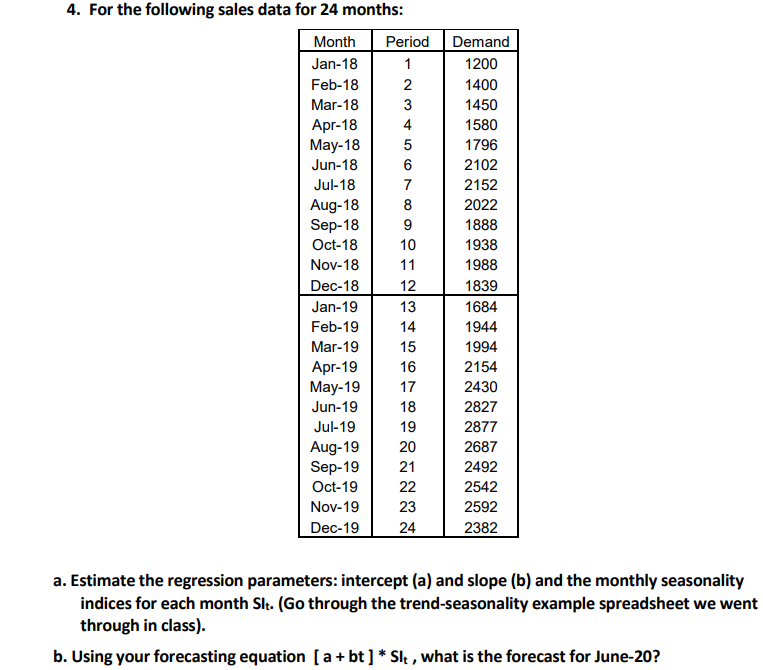
Question: PLEASE USE EXCEL AND SHOW ALL FORMULAS FOR EVERYTHING AND EXPLANATIONS Thanks 4. For the following sales data for 24 months: Month Period Jan-18 1

PLEASE USE EXCEL AND SHOW ALL FORMULAS FOR EVERYTHING AND EXPLANATIONS

Thanks

PLEASE USE EXCEL AND SHOW ALL FORMULAS FOR

4. For the following sales data for 24 months: Month Period Jan-18 1 Feb-18 2 Mar-18 3 Apr-18 4 May-18 5 Jun-18 6 Jul-18 7 Aug-18 8 Sep-18 9 Oct-18 10 Nov-18 11 Dec-18 12 Jan-19 13 Feb-19 14 Mar-19 15 Apr-19 16 May-19 17 Jun-19 18 Jul-19 19 Aug-19 20 Sep-19 21 Oct-19 22 Nov-19 23 Dec-19 Demand 1200 1400 1450 1580 1796 2102 2152 2022 1888 1938 1988 1839 1684 1944 1994 2154 2430 2827 2877 2687 2492 2542 2592 2382 24 a. Estimate the regression parameters: intercept (a) and slope (b) and the monthly seasonality indices for each month Slt. (Go through the trend-seasonality example spreadsheet we went through in class). b. Using your forecasting equation [a+bt ] * Sl , what is the forecast for June-20

Step by Step Solution

There are 3 Steps involved in it

1 Expert Approved Answer
Step: 1 Unlock blur-text-image
Question Has Been Solved by an Expert!

Get step-by-step solutions from verified subject matter experts

Step: 2 Unlock
Step: 3 Unlock

Students Have Also Explored These Related General Management Questions!