

Question: Please use excel and solver and take screenshots An analyst for Phidelity Investments wants to develop a regression model to predict the annual rate of
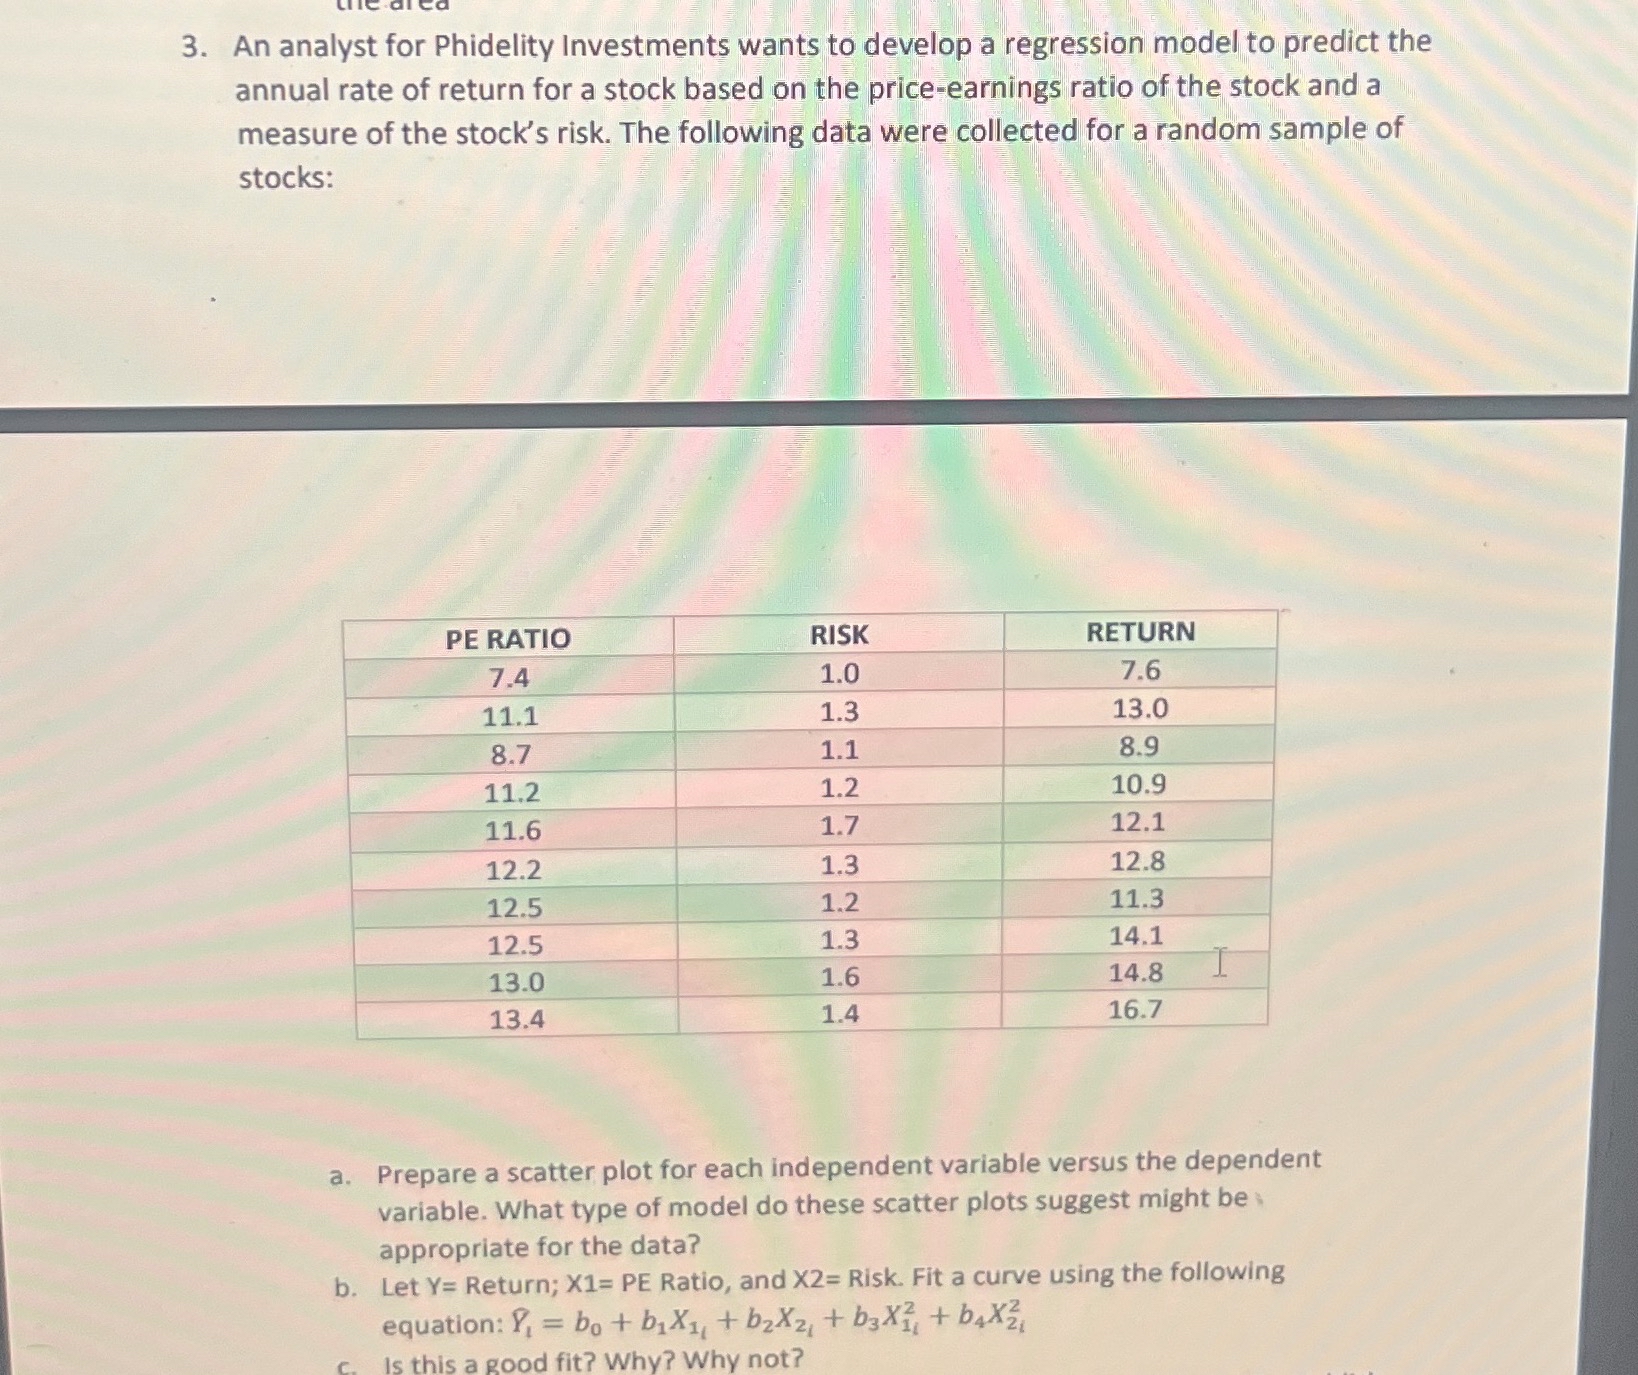
Please use excel and solver and take screenshots An analyst for Phidelity Investments wants to develop a regression model to predict the annual rate of return for a stock based on the priceearnings ratio of the stock and a measure of the stock's risk. The following data were collected for a random sample of stocks:
tablePE RATIO,RISK,RETURN
a Prepare a scatter plot for each independent variable versus the dependent variable. What type of model do these scatter plots suggest might be appropriate for the data?
b Let Return; Ratio, and Risk. Fit a curve using the following equation:
c Is this a good fit? Why? Why not?
Step by Step Solution
There are 3 Steps involved in it
1 Expert Approved Answer
Step: 1 Unlock

Question Has Been Solved by an Expert!
Get step-by-step solutions from verified subject matter experts
Step: 2 Unlock
Step: 3 Unlock