

Question: please use excel in ALL answers. step by step please show how to put this informatin in a table before and graphs also Textbook Sales.
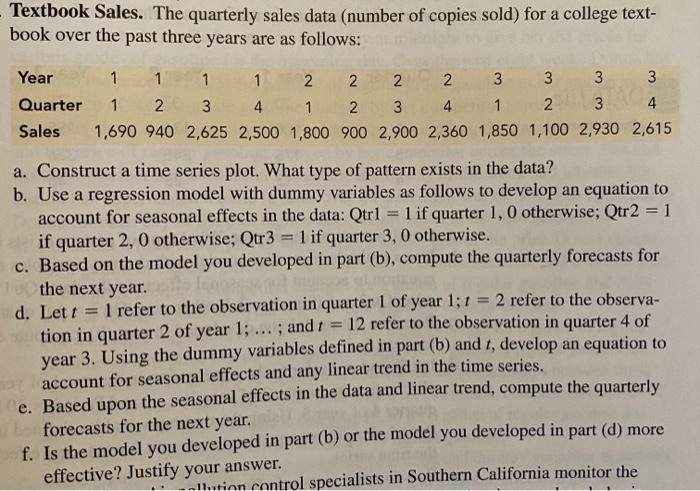
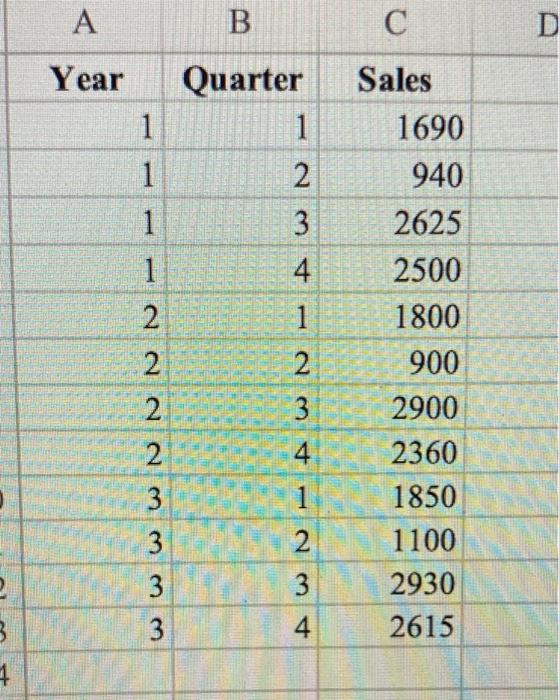
Textbook Sales. The quarterly sales data (number of copies sold) for a college text- book over the past three years are as follows: Year 1 1 1 1 2 2 2 3 3 3 3 Quarter 1 2 3 4 1 2 3 4 1 2 3 4 Sales 1,690 940 2,625 2,500 1,800 900 2,900 2,360 1,850 1,100 2,930 2,615 a. Construct a time series plot. What type of pattern exists in the data? b. Use a regression model with dummy variables as follows to develop an equation to account for seasonal effects in the data: Qtr1 = 1 if quarter 1, 0 otherwise; Qtr 2 = 1 if quarter 2,0 otherwise; Qtr3 = 1 if quarter 3,0 otherwise. c. Based on the model you developed in part (b), compute the quarterly forecasts for the next year. d. Lett 1 refer to the observation in quarter 1 of year 1; 1 = 2 refer to the observa- tion in quarter 2 of year 1; ...; and 12 refer to the observation in quarter 4 of year 3. Using the dummy variables defined in part (b) and 1, develop an equation to account for seasonal effects and any linear trend in the time series. e. Based upon the seasonal effects in the data and linear trend, compute the quarterly forecasts for the next year. f. Is the model you developed in part (b) or the model you developed in part (d) more effective? Justify your answer. Ilution control specialists in Southern California monitor the A B D Year Quarter 1 1 1 1 1 AN 1 2 1 1 2 3 Sales 1690 940 2625 2500 1800 900 2900 2360 1850 1100 2930 2615 4 2 2 3 3 1 2 3 3 2. 3 4. 3 4
Step by Step Solution
There are 3 Steps involved in it

Get step-by-step solutions from verified subject matter experts