Question: please use excel to answer this and please show formulas. ans multilinear regression please. thank you here are the answers for A and B to

please use excel to answer this and please show formulas. ans multilinear regression please. thank you please use excel to answer this and please show
please use excel to answer this and please show
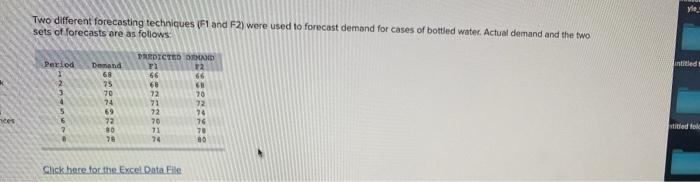
here are the answers for A and B to help you solve D
please use excel to answer this and please show
yle Two different forecasting techniques (F1 and F2) were used to forecast demand for cases of bottled water. Actual demand and the two sets of forecasts are as follows: Period intitled 2 3 4 Demand 68 75 70 74 69 72 80 78 PASDICTED AND 12 56 66 68 72 70 71 72 72 74 70 76 71 70 74 80 mes titled to Click here for the Excel Data File d. Compute MAPE for each data set. Which forecast appears to be more accurate? (Round your intermediate calculations and final answers to 2 decimal places.) 5.34% MAPE F1 MAPE F2 4.11% appears to be more accurate A B C D E F G H Method 1 Period A Method 2 2 F ILI (II)^2 F IE, (1, 1)^2 31 68 66 -ABS(B3-C3) -D342 66 ABS(B3-F3) -G3A2 42 75 68 ABS(84-C4) -D42 68 -ABS[B4-F4) -G42 5 3 70 72 =ABSBS-C5) -D5A2 70 =ABS(B5-F5) -GSAZ 64 7471 ABS(86-C6) -D6A2 22 -ABS(86-F6 -G642 75 69 72 -ABS(87.07) -D7A2 74 ABS[B7-F7) -G742 8 6 72 70 ABS(B8-08) -D842 76 ABS(B8-FB) -GBA2 97 80 71 ABS(B9-09) 0912 78 ABS(89-19) -G9A2 10 8 78 74 ABS(B10-C10) 010^2 80 -ABS(810-F10) -G10^2 11 Total SUM(D3:010) ESUM(E3:10) - ESUM(G3.G10) =SUM(3:10) 12 AVERAGE(D3:010) AVERAGE(E3:E10) -AVERAGE(GS:G10) -AVERAGE(H3:110) 13 MAD MSE MAD MSE Where, At = Actual Values F1 = Forecast Values for Method 1 F2 = Forecast Values for Method 2 Et = Absolute Error Values Between At and Ft Step 2: Output Table: C Period A F 2 3 4 5 1 2 3 4 Method 1 TEL 2.0 7.0 2.0 6 7 8 68 75 70 74 69 72 80 78 Total 5 68 72 71 72 70 71 74 F 66 68 70 72 74 76 78 80 (1E, 1)^2 4.0 49.0 4.0 9.0 9.0 4.0 81.0 16.0 176.0 22.00 MSE Method 2 IE (11)^2 2.0 4.0 7.0 49.0 0.0 0.0 2.0 4.0 5.0 25.0 4,0 16.0 2.0 4.0 2.0 4.0 24.0 106.0 3.00 13.25 MAD MSE 6 7 3.0 2.0 9.0 4.0 32.0 4.0 MAD 8 9 10 11 12 13 Here, the MAD and MSE values are lesser for Method 2 (F2), hence, we may conclude that F2 appears to be more appropriate (Kindly, raise an upvote for this answer)

Step by Step Solution

There are 3 Steps involved in it

1 Expert Approved Answer
Step: 1 Unlock blur-text-image
Question Has Been Solved by an Expert!

Get step-by-step solutions from verified subject matter experts

Step: 2 Unlock
Step: 3 Unlock

Students Have Also Explored These Related General Management Questions!