

Question: Please use excel to answer this question. Regression Project: Prot 1. Recall that prot can be computed in terms of revenue and cost. Assume that
Please use excel to answer this question.
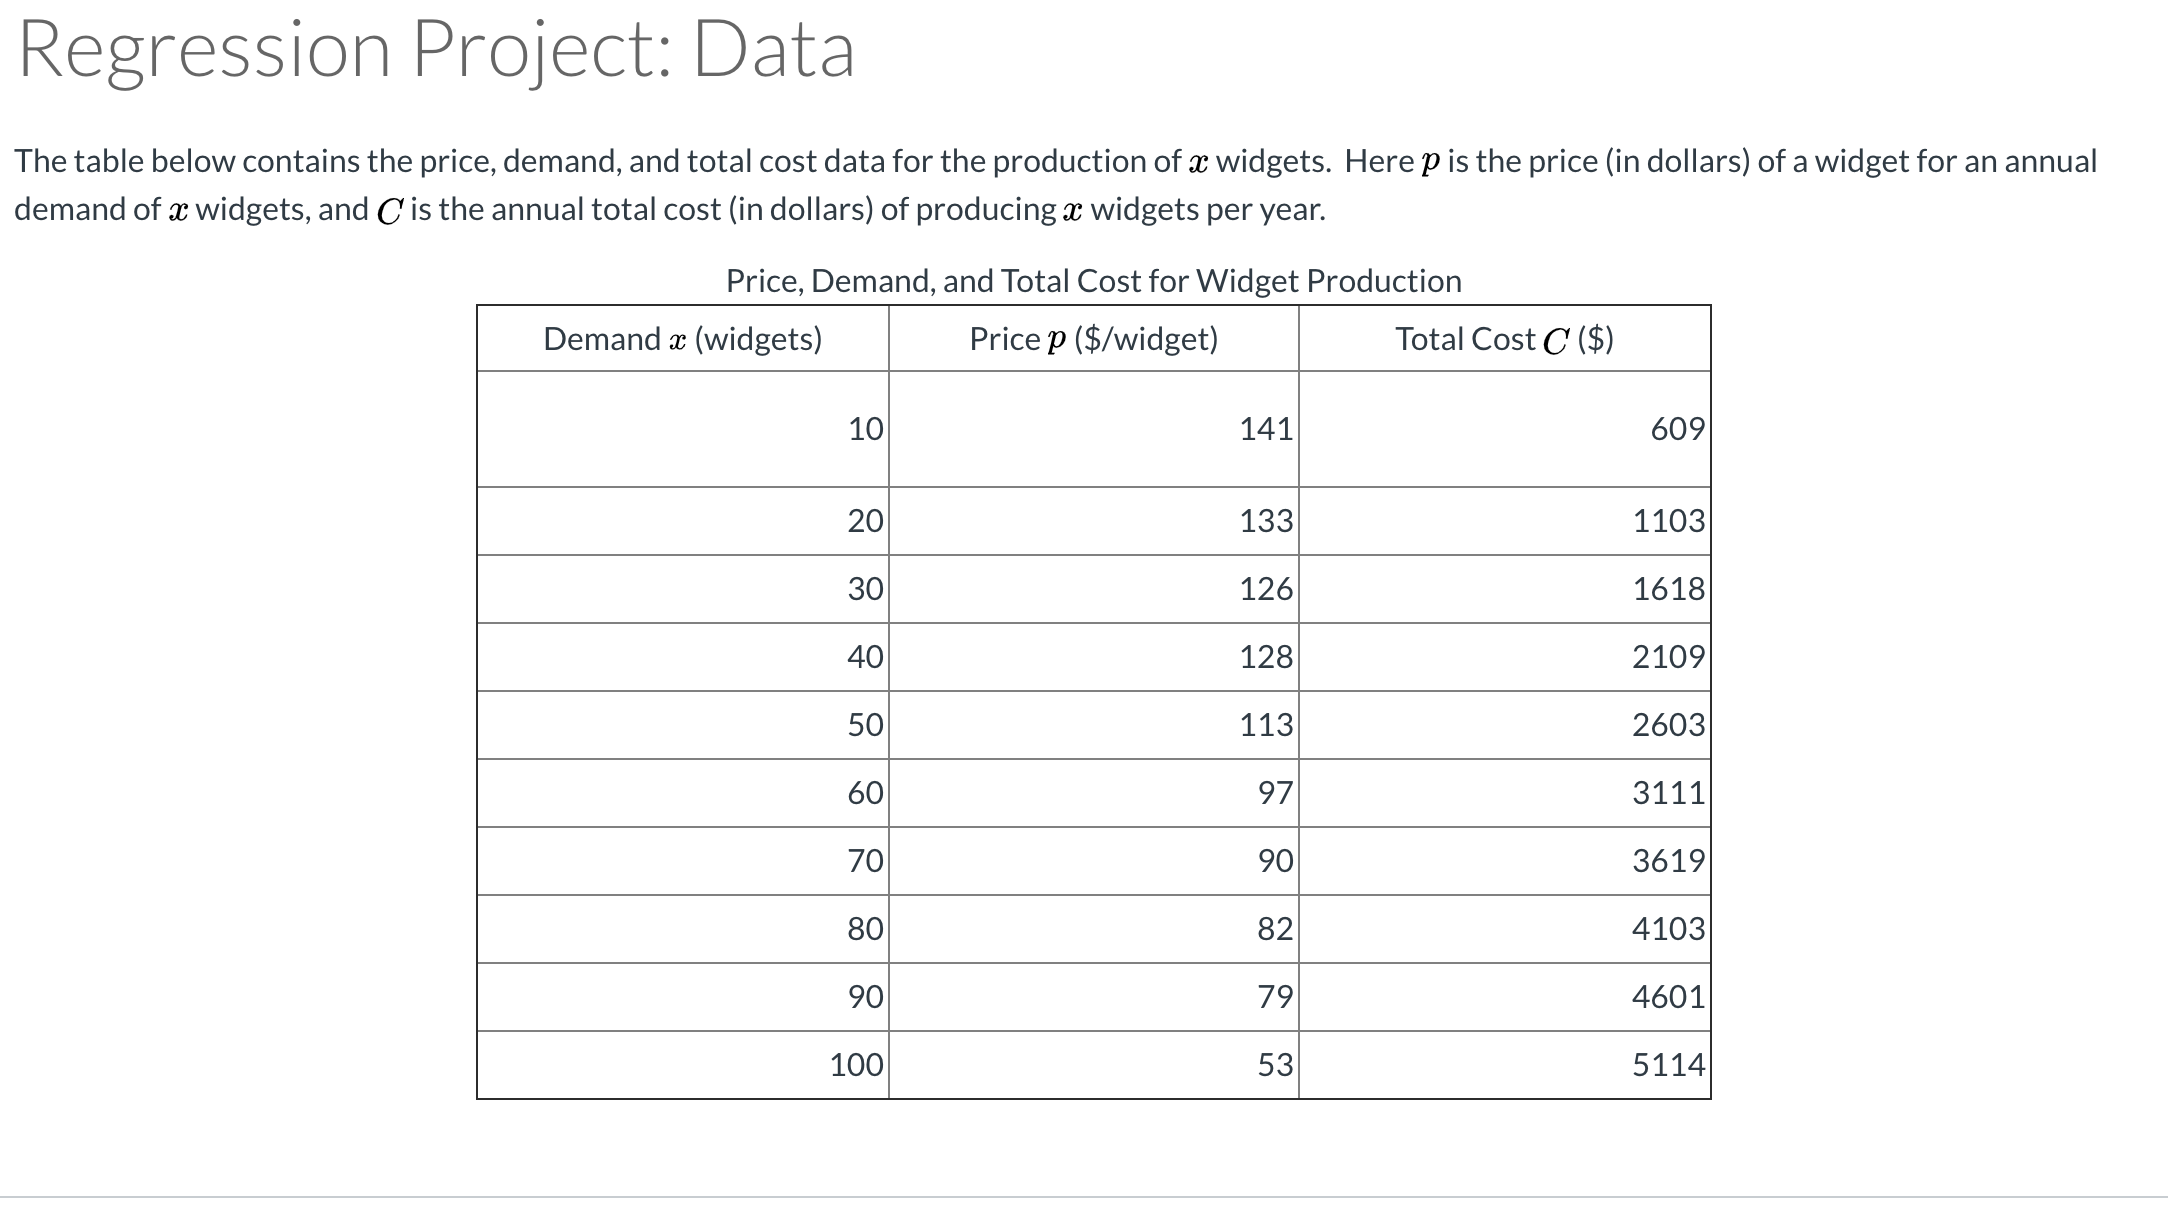
Regression Project: Prot 1. Recall that prot can be computed in terms of revenue and cost. Assume that the annual widget sales match the annual widget demand and annual widget production. Construct a model for prot using the models for revenue and cost that you found in the Revenue and Cost sections. Give your model for prot P(ac), where P(ac) is the total annual prot in dollars for a: widgets sold. 2. Plot your models for cost, revenue, and prot on the same graph. Adjust the max/min to display the data in a reasonable way. On the plot, be sure to 0 Make a title for the plot "Total Cost, Revenue, and Prot". 0 Label your axes. Label the horizontal axis "Annual widget production", and label the vertical axis "Total cost/revenue/prot of producing widgets ($)". 0 Label the graphs or include a legend to make it clear which graph is which. 3. What are the break-even points? What is the prot at the break-even points? Be sure to answer in complete sentences and to include units. Explain how you found the results. 4. What number of widgets sold will yield positive prot? Be sure to answer in complete sentences and to include units. Explain how you found the results. 5. Determine the number of widgets that you should try to sell in order to maximize prot. What is the maximum prot? Be sure to answer in complete sentences and to include units. Explain how you found the results. Regression Project: Data The table below contains the price, demand, and total cost data for the production of a: widgets. Here 11 is the price (in dollars) of a widget for an annual demand of a: widgets, and C is the annual total cost (in dollars) of producing a: widgets per year. Price, Demand, and Total Cost for Widget Production Demand ac (widgets) Price :0 ($/widget) Total Cost 0 ($) 10 141 609 20 133 1103 30 126 1618 40 128 2109 50 113 2603 60 97 3111 70 90 3619 80 82 4103 90 79 4601 100 53 5114
Step by Step Solution
There are 3 Steps involved in it

Get step-by-step solutions from verified subject matter experts