

Question: , please use Excel to reconstruct the table for Revenues in a way that you find easier to read. You can rearrange the data, if
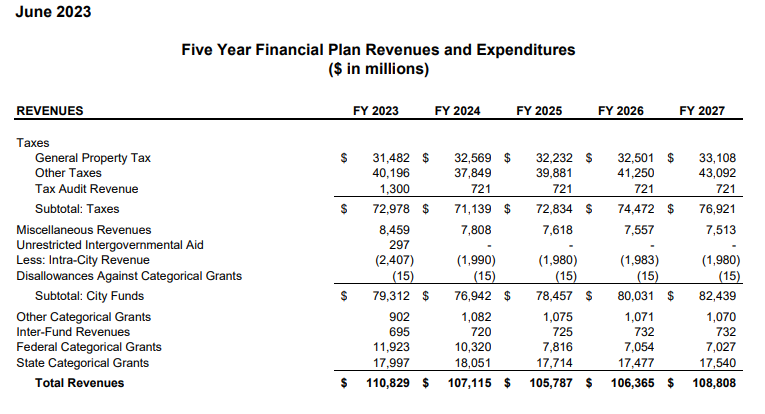
, please use Excel to reconstruct the table for Revenues in a way that you find easier to read. You can rearrange the data, if necessary, as well as use headings, indentation, spacing or other measures to present the information clearly
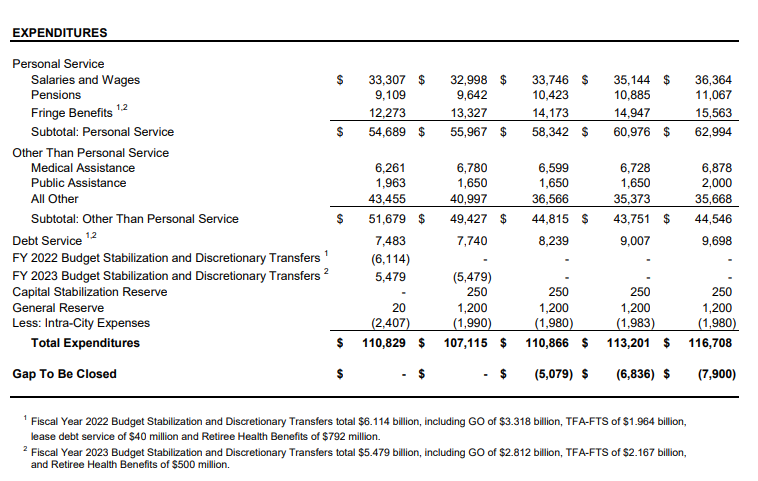
Five Year Financial Plan Revenues and Expenditures (\$ in millions) 1 Fiscal Year 2022 Budget Stabilization and Discretionary Transfers total $6.114 billion, including GO of $3.318 billion, TFA-FTS of $1.964 billion, lease debt service of $40 million and Retiree Health Benefits of $792 million. 2 Fiscal Year 2023 Budget Stabilization and Discretionary Transfers total $5.479 billion, including GO of $2.812 billion, TFA-FTS of $2.167 billion, and Retiree Health Benefits of $500 million. Five Year Financial Plan Revenues and Expenditures (\$ in millions) 1 Fiscal Year 2022 Budget Stabilization and Discretionary Transfers total $6.114 billion, including GO of $3.318 billion, TFA-FTS of $1.964 billion, lease debt service of $40 million and Retiree Health Benefits of $792 million. 2 Fiscal Year 2023 Budget Stabilization and Discretionary Transfers total $5.479 billion, including GO of $2.812 billion, TFA-FTS of $2.167 billion, and Retiree Health Benefits of $500 million
Step by Step Solution
There are 3 Steps involved in it

Get step-by-step solutions from verified subject matter experts