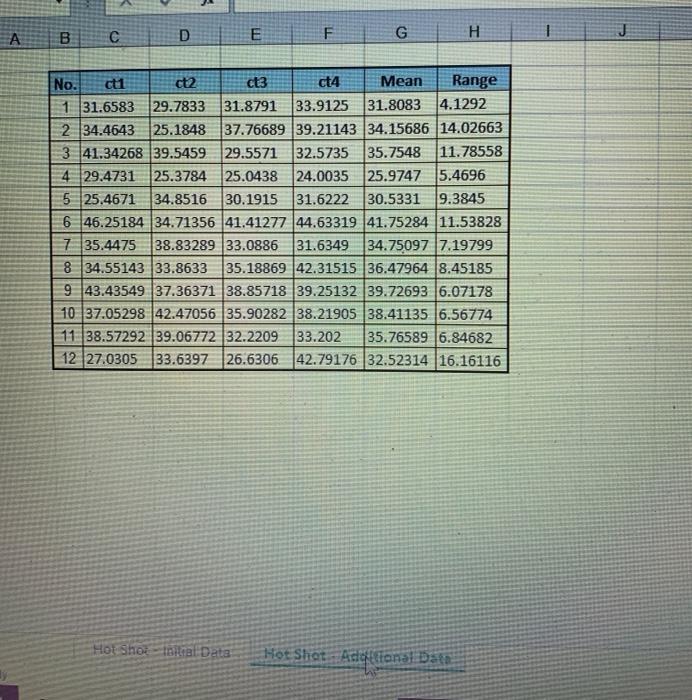
Question: please Use excel to solve it Case Study 1: Hot Shot Plastics Company No 2 Man Range 1 27 34667 27.505 23.94412128 21249 28 25103

please Use excel to solve it please Use excel to solve it Case Study 1: Hot
please Use excel to solve it Case Study 1: Hot
Case Study 1: Hot Shot Plastics Company No 2 Man Range 1 27 34667 27.505 23.94412128 21249 28 25103 2.59745 227.77695 26. 15006 31 21295 31.33272 29.123175 18266 3 33 51255 29.32971 29.7045 31.053 30.0497 4,20284 4 37994093226942 3191741 29 44279 32.90343 85413 33 8772230325692838117 33.70124 31 558775.44605 6 29 58356 29 56672 27.2.3077 34 00417 30.12132 67734 Y 26 3203 32.0789236.17198 31.79949.8516 030.29575 30.5286243315 26.85241 2802751 6.09553 9 28 45856 30.48251 32.430 76162 30.52898 399227 10 28.277933 94915 30.47405 28.87447 30 3939 5.67126 11 26.91882766133 314936 29.669282892971 455051 12 28.46547 28 2993725 99641 3114511 29.22609284574 15324267726104129.4771 37.20079 31302211109609 1428.84273 30.51803724614 30.47104 30.51698339341 15 30 75135 32 99922 28.08422619981 29.508736.79941 16 31.25756 24 29473 35 46477 28.41126 29.85708 11 17004 17 31.249212857954 35.00055 31215913151833642911 183151554580049 33 60909 27.821312161617.97918 10 32.202.5 12.2005 37.71015 29.3753 23577183.83398 20 25 91603 29.777758392610 33.78360311011 27.01099 21 35 05323 32.99284 31516412279615 31.0966791707 22 32 1248329 3285320997092139548 30 96272 2.796 23 30.09272 32.439382734725 20 70725902714 459215 2080048352723709 22.018012869524 26.99992 3.03034 25 293027320 725 3022735 3.90789 30.71899 2.5040 Plastic keychains are being produced in a company named Hot Shot Plastics. The plastic material is first molded and then trimmed to the required shape. The curetimes (which is the time for the plastic to cool during the molding process affect the edge quality of the keychains produced. The aim is to achieve statistical control of the curetimes using X bar and charts. Curetime data of 25 samples, each of size four, have been taken when the process is assumed to be in control. These are shown as follows. (Note: The spreadsheet 13 Statistical Process Control has these data) 1. Prepare X bar and Richarts using these data with the method described in the chapter. 2. Analyze the charts and comment on whether the process appears to be in control and stable. 1. Twelve additional samples of curetime data from the molding process were collected from an actual production run, The data from these new samples are shown as follows. Update your control charts and compare the results with the previous data. The X bar and R-charts are drawn with the new data using the same control tits established before. Comment on what the new charts show. - A B D H E F G 1 No. cti ct2 ct3 ct4 Mean Range 1 31.6583 29.7833 31.8791 33.9125 31.8083 4.1292 2 34.4643 (25.1848 37.76689 39.21143 34.15686 14.02663 3 41.34268 39.5459 29.5571 32.5735 35.7548 11.78558 4 29.4731 25.3784 25.0438 24.0035 25.9747 15.4696 5 25.4671 34.8516 30.1915 31.6222 30.5331 9.3845 6 46.25184 34.71356 41.41277 44.63319 41.75284 11.53828 7 35.4475 38.83289 33.0886 31.6349 34.75097 7.19799 8 34.55143 33.8633 35.18869 42.31515 36.47964 8.45185 9 43.43549 37.36371 38.85718 39.25132 39.72693 6.07178 10 37.05298 42.47056 35.90282 38.21905 38.41135 6.56774 11 38.57292 39.06772 32.220933.202 35.76589 16.84682 12 27.0305 33.639726.6306. 142.79176 32.52314 116.16116 Hot Shoe Bilal Data Hot Shet. Adottional Data

Step by Step Solution

There are 3 Steps involved in it

1 Expert Approved Answer
Step: 1 Unlock blur-text-image
Question Has Been Solved by an Expert!

Get step-by-step solutions from verified subject matter experts

Step: 2 Unlock
Step: 3 Unlock

Students Have Also Explored These Related General Management Questions!