

Question: please use matlab code c. Create a plot of the distribution for COF. The normal distribution is plotted using the following formula. To make this
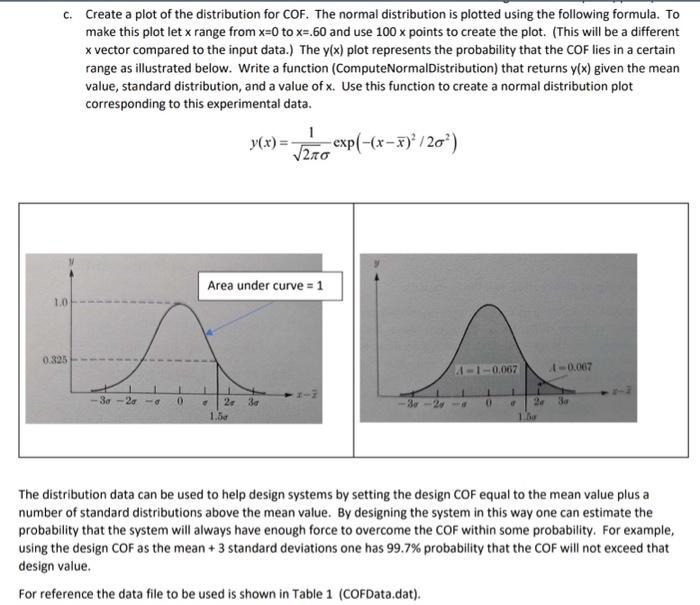
c. Create a plot of the distribution for COF. The normal distribution is plotted using the following formula. To make this plot let x range from x=0 to x=.60 and use 100x points to create the plot. (This will be a different x vector compared to the input data.) The y(x) plot represents the probability that the COF lies in a certain range as illustrated below. Write a function (ComputeNormalDistribution) that returns y(x) given the mean value, standard distribution, and a value of x. Use this function to create a normal distribution plot corresponding to this experimental data. y(x)=21exp((xx)2/22) The distribution data can be used to help design systems by setting the design COF equal to the mean value plus a number of standard distributions above the mean value. By designing the system in this way one can estimate the probability that the system will always have enough force to overcome the COF within some probability. For example, using the design COF as the mean +3 standard deviations one has 99.7% probability that the COF will not exceed that design value. For reference the data file to be used is shown in Table 1 (COFData.dat)
Step by Step Solution
There are 3 Steps involved in it

Get step-by-step solutions from verified subject matter experts