

Question: Please use MatLab, thanks! Create a vector of angles from 0 to 2. Use the polar plotting function to create graphs of the functions that
Please use MatLab, thanks!
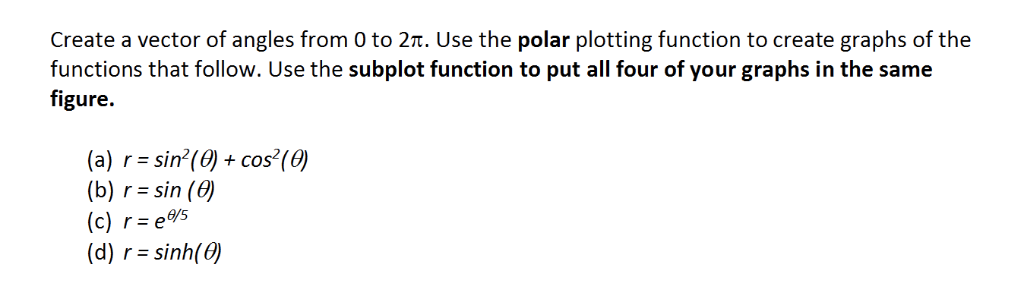
Create a vector of angles from 0 to 2. Use the polar plotting function to create graphs of the functions that follow. Use the subplot function to put all four of your graphs in the same figure. + COS (b) rsin (e) (c) r ees (d) : sinh() Create a vector of angles from 0 to 2. Use the polar plotting function to create graphs of the functions that follow. Use the subplot function to put all four of your graphs in the same figure. + COS (b) rsin (e) (c) r ees (d) : sinh()
Step by Step Solution
There are 3 Steps involved in it
1 Expert Approved Answer
Step: 1 Unlock

Question Has Been Solved by an Expert!
Get step-by-step solutions from verified subject matter experts
Step: 2 Unlock
Step: 3 Unlock