

Question: Make my code output the same thing as the first image Basic Matlab Plotting: Use Matlab to create the following single plot with three subplots.
Make my code output the same thing as the first image
Basic Matlab Plotting:
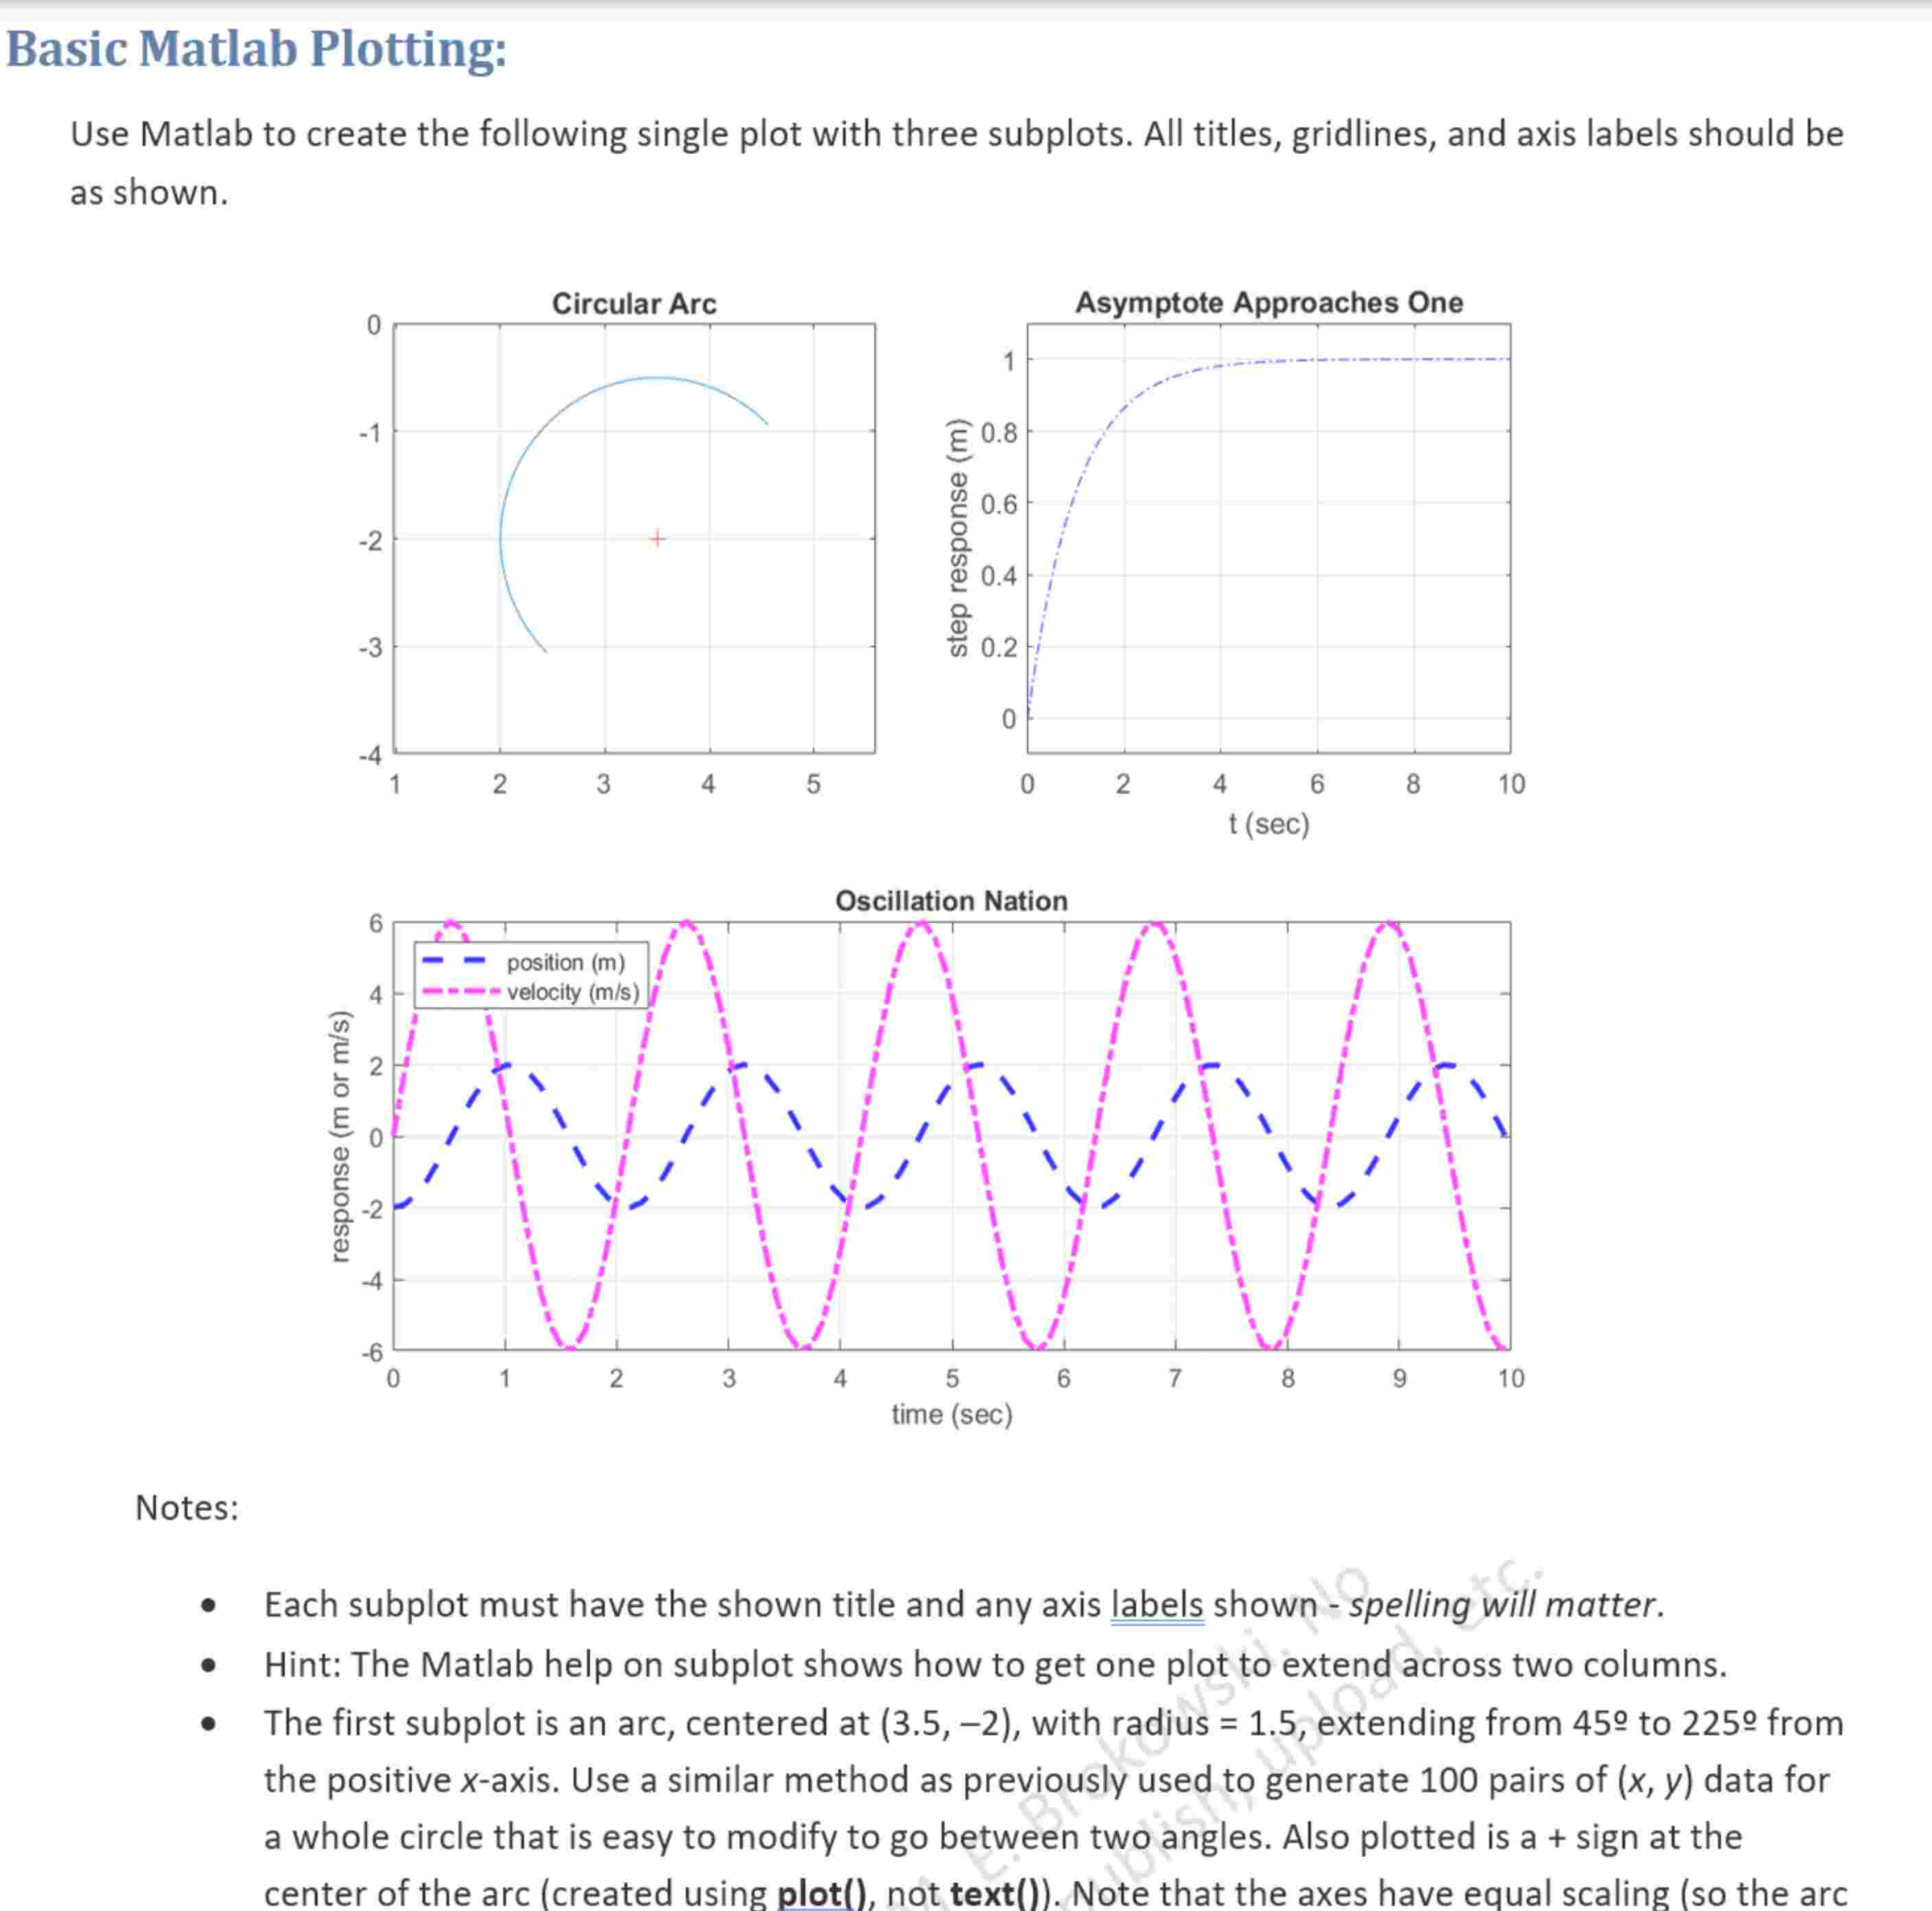
Use Matlab to create the following single plot with three subplots. All titles, gridlines, and axis labels should be as shown.
Notes:
Each subplot must have the shown title and any axis labels shown spelling will matter.
Hint: The Matlab help on subplot shows how to get one plot to extend across two columns.
The first subplot is an arc, centered at with radius extending from to from the positive x axis. Use a similar method as previously used to generate pairs of x y data for a whole circle that is easy to modify to go between two angles. Also plotted is a sign at the center of the arc created using plot not text Note that the axes have equal scaling so the arc
Notes:
Each subplot must have the shown title and any axis labels shownspelling will matter.
Hint: The Matlab help on subplot shows how to get one plot to extend across two columns.
The first subplot is an arc, centered at with radius extending from to from
the positive xaxis. Use a similar method as previously used to generate pairs of xy data for
a whole circle that is easy to modify to go between two angles. Also plotted is a sign at the
center of the arc created using plot not text Note that the axes have equal scaling so the arc
is circular and not squished and they extend at least past where the circle containing the arc
would be xlim and ylim
The second plot is response exp time plotted from to with blue dashdot lines. Note
the title and axis labels. Set the yaxis limits such that the lower limit is clearly below the lowest
part of the curve.
The third is two curves: poscos t and vel sin t The subplot uses the whole plot width.
There must be axis labels, a legend positioned as shown, and the LineWidth of both curves is for
better visibility.
Some of the functions you will use are also in the PDF handout available on CatCourses.
Plotting a figure with subplots
create and clear a figure
clear all;
clf;
figure;
create the three subplots
Step : Set Up the Circular Arc Plot
theta linspacedegrad degrad; Angle range for the arc
x costheta; xcoordinates of the arc
y sintheta; ycoordinates of the arc
subplot; Position in a x grid
plotx yb; Plot the arc in blue
hold on;
plotr; Center point of the arc in red
titleCircular Arc'; Title
axis equal; Ensure equal scaling for a true circular appearance
xlim; xaxis limits
ylim; yaxis limits
grid on; Turn on grid
hold on
Step : Set Up the Asymptote Plot
t linspace ; Time vector
response exp t; Step response approaching an asymptote
subplot; Position in the x grid
plott response, b:; Plot the response as a blue dotted line
titleAsymptote Approaches One'; Title
xlabelt sec; xaxis label
ylabelStep response m; yaxis label
grid on; Turn on grid
ylim; Set yaxis limits to focus on the asymptote
Step : Set Up the Oscillation Plot
t linspace; Time vector extended for clarity
position sin pi t; Oscillating position with a frequency of Hz
velocity pi cos pi t; Corresponding velocity derivative of position
subplot; Full width subplot in a x grid
plott position, m t velocity, b;
titleOscillation Nation';
xlabelTime sec;
ylabelResponse m or ms;
legendpositionm'velocityms'location','northwest'
grid on;
Step by Step Solution
There are 3 Steps involved in it
1 Expert Approved Answer
Step: 1 Unlock

Question Has Been Solved by an Expert!
Get step-by-step solutions from verified subject matter experts
Step: 2 Unlock
Step: 3 Unlock