

Question: Please use MATLAB, thanks. https://www.chegg.com/homework-help/questions-and-answers/matlab-1-functions-fscanf-textscan-write-script-function-compare--first-script-read-datatx-q28369460?trackid=5fe9e94d&strackid=16ad20e2&ii=1 This is a link for the hw 9 problem. use HW9 SB temperature data read by either fgetl, fscanf or
Please use MATLAB, thanks.
https://www.chegg.com/homework-help/questions-and-answers/matlab-1-functions-fscanf-textscan-write-script-function-compare--first-script-read-datatx-q28369460?trackid=5fe9e94d&strackid=16ad20e2&ii=1
This is a link for the hw 9 problem.
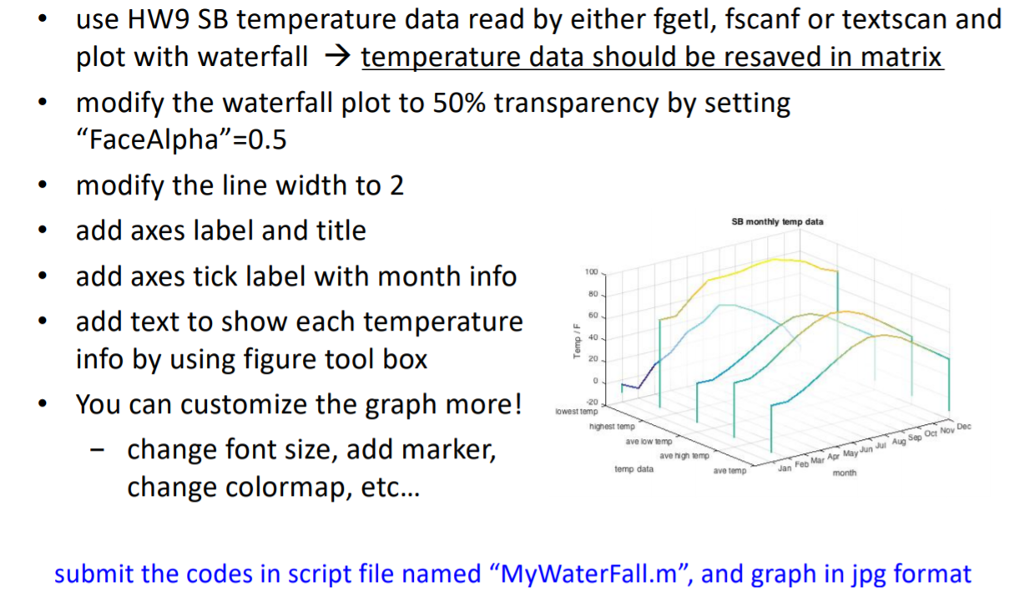
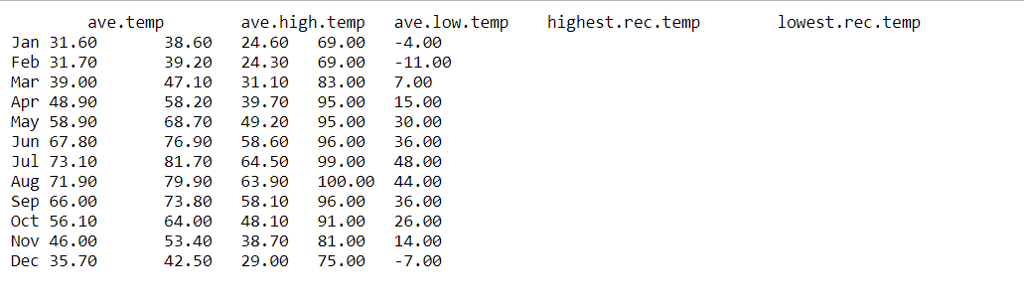
use HW9 SB temperature data read by either fgetl, fscanf or textscan and plot wit i Wia eniall ) iernperaiure daia should be resaved in rrlaTIX modify the waterfall plot to 50% transparency by setting "FaceAlpha"-0.5 modify the line width to 2 . SB monthly temp data add axes label and title add axes tick label with month info 100 . 80 add text to show each temperature * 60 40 info by using figure tool box 20 .You can customize the graph more5 nignest temp ave high tmp temp data ave temp month change colormap, etc... submit the codes in script file named "MyWaterFall.m", and graph in jpg format use HW9 SB temperature data read by either fgetl, fscanf or textscan and plot wit i Wia eniall ) iernperaiure daia should be resaved in rrlaTIX modify the waterfall plot to 50% transparency by setting "FaceAlpha"-0.5 modify the line width to 2 . SB monthly temp data add axes label and title add axes tick label with month info 100 . 80 add text to show each temperature * 60 40 info by using figure tool box 20 .You can customize the graph more5 nignest temp ave high tmp temp data ave temp month change colormap, etc... submit the codes in script file named "MyWaterFall.m", and graph in jpg format
Step by Step Solution
There are 3 Steps involved in it

Get step-by-step solutions from verified subject matter experts