

Question: Please use Microsoft Excel and show the graphs. You are given a copper cylindrical rod of 1-cm radius and 1-m length. The thermal diffusivity of
Please use Microsoft Excel and show the graphs.
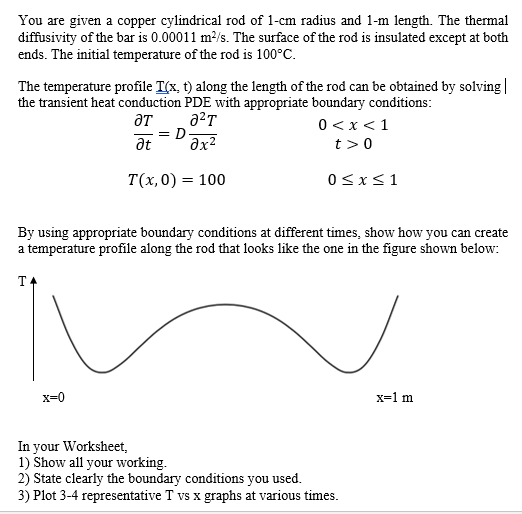
You are given a copper cylindrical rod of 1-cm radius and 1-m length. The thermal diffusivity of the bar is 0.00011 m2/s. The surface of the rod is insulated except at both ends. The initial temperature of the rod is 100C. The temperature profile T(x, t) along the length of the rod can be obtained by solving | the transient heat conduction PDE with appropriate boundary conditions: 22T 0
Step by Step Solution
There are 3 Steps involved in it

Get step-by-step solutions from verified subject matter experts