

Question: please use python and i will import all csv need files(VERY IMPORTANT) 10. You are asked to analyse the following five variables [ TNDPRO', 'S&P
please use python and i will import all csv need files(VERY IMPORTANT)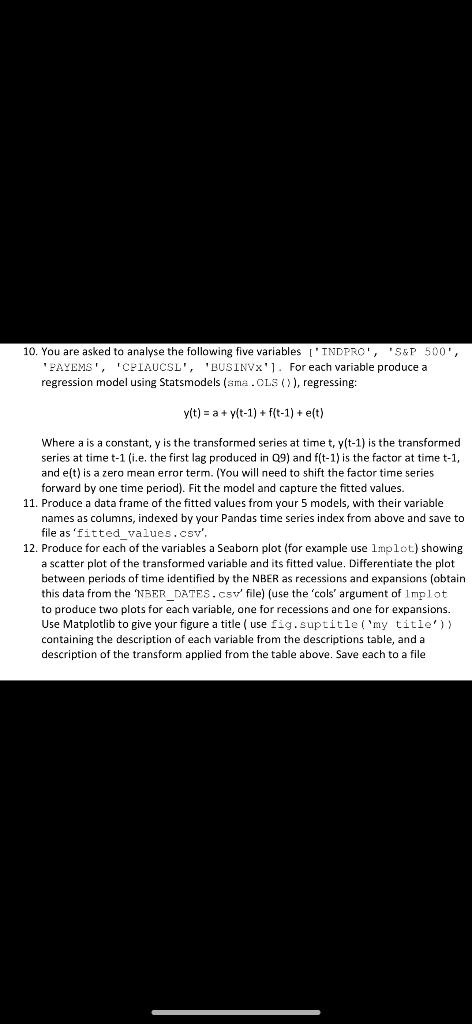
10. You are asked to analyse the following five variables [ "TNDPRO', 'S\&P 500, ' AYEMS', 'CEIAUCSL', 'BUSINVX']. For each variable produce a regression model using Statsmodels ( Gma. . Ls ()), regressing: y(t)=a+y(t1)+f(t1)+e(t) Where a is a constant, y is the transformed series at time t,y(t1) is the transformed series at time t1 (i.e. the first lag produced in Q9 ) and f(t1) is the factor at time t1, and e(t ) is a zero mean error term. (You will need to shift the factor time series forward by one time period). Fit the model and capture the fitted values. 11. Produce a data frame of the fitted values from your 5 models, with their variable names as columns, indexed by your Pandas time series index from above and save to file as 'fitted_values. csv', 12. Produce for each of the variables a Seaborn plot (for example use lmplot) showing a scatter plot of the transformed variable and its fitted value. Differentiate the plot between periods of time identified by the NBER as recessions and expansions (obtain this data from the 'NBER DRTES. CSV' file) (use the 'cols' argument of 1 np 1 ot to produce two plots for each variable, one for recessions and one for expansions. Use Matplotlib to give your figure a title (use fig. suptitle ('my title')) containing the description of each variable from the descriptions table, and a description of the transform applied from the table above. Save each to a file
Step by Step Solution
There are 3 Steps involved in it

Get step-by-step solutions from verified subject matter experts