

Question: PLEASE USE PYTHON Now we'll create some artificial data to practice on. We're generating the data by adding noise to the usual square root function.
PLEASE USE PYTHON 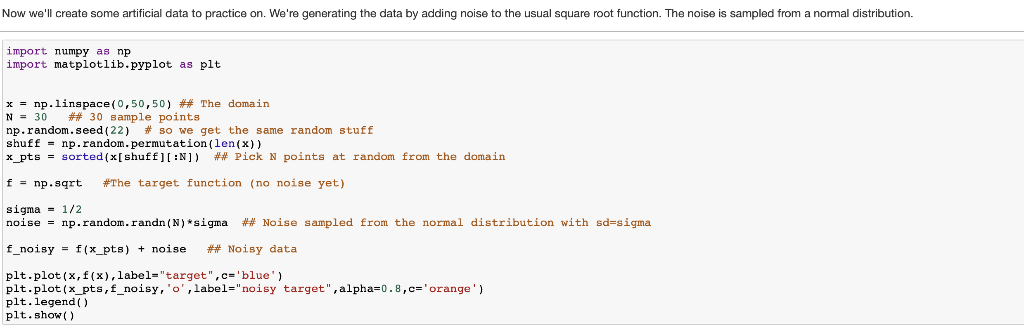
Now we'll create some artificial data to practice on. We're generating the data by adding noise to the usual square root function. The noise is sampled from a normal distribution. import numpy as np import matplotlib.pyplot as plt x = np.linspace( 0,50,50) ## The domain N 30 ## 30 sample points np. random . seed(22) # so we get the same random stuff shuff np.random.permutation(len(x)) x-pts-sorted (x(shuff][:N]) ## Pick N polnts at random from the domain f-np.sqrt #The target function (no noise yet) sigma 1/2 noise-np. randon . randn (N) *sigma ## Noise sampled from the normal distribution with sd-sigma f-noisy f(x-pts) noise Noisy data - + plt.plot(x,f(x),label-"target",c-'blue' plt.plot (x-pts,f-noisy, 'o', label-"noisy target ",alpha#0.8,c-'orange') plt.legend) plt.show) Now we'll create some artificial data to practice on. We're generating the data by adding noise to the usual square root function. The noise is sampled from a normal distribution. import numpy as np import matplotlib.pyplot as plt x = np.linspace( 0,50,50) ## The domain N 30 ## 30 sample points np. random . seed(22) # so we get the same random stuff shuff np.random.permutation(len(x)) x-pts-sorted (x(shuff][:N]) ## Pick N polnts at random from the domain f-np.sqrt #The target function (no noise yet) sigma 1/2 noise-np. randon . randn (N) *sigma ## Noise sampled from the normal distribution with sd-sigma f-noisy f(x-pts) noise Noisy data - + plt.plot(x,f(x),label-"target",c-'blue' plt.plot (x-pts,f-noisy, 'o', label-"noisy target ",alpha#0.8,c-'orange') plt.legend) plt.show)
Step by Step Solution
There are 3 Steps involved in it

Get step-by-step solutions from verified subject matter experts