

Question: please use R and provide the code data set: kilotons,seismic 29,5.6 125,6.1 100,6 4,4.8 10,5.2 60,5.8 10,5.4 125,6 40,5.7 90,5.9 16,5.5 12,5.3 23,5.5 16,5.4 6,5.1
please use R and provide the code
data set:
kilotons,seismic 29,5.6 125,6.1 100,6 4,4.8 10,5.2 60,5.8 10,5.4 125,6 40,5.7 90,5.9 16,5.5 12,5.3 23,5.5 16,5.4 6,5.1 8,5 2,4.9 165,6.1 140,6
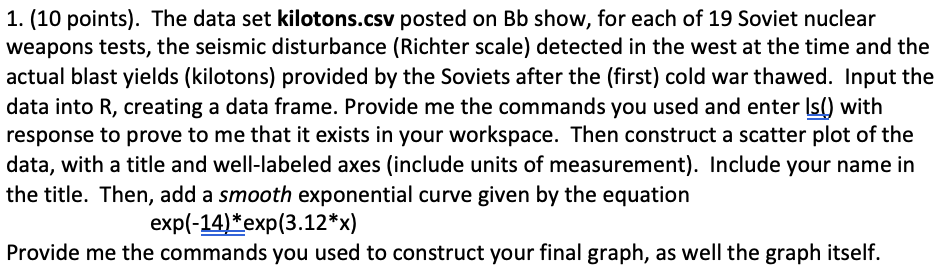
1. (10 points). The data set kilotons.csv posted on Bb show, for each of 19 Soviet nuclear weapons tests, the seismic disturbance (Richter scale) detected in the west at the time and the actual blast yields (kilotons) provided by the Soviets after the (first) cold war thawed. Input the data into R, creating a data frame. Provide me the commands you used and enter Isl) with response to prove to me that it exists in your workspace. Then construct a scatter plot of the data, with a title and well-labeled axes (include units of measurement). Include your name in the title. Then, add a smooth exponential curve given by the equation exp(-14) *exp(3.12*x) Provide me the commands you used to construct your final graph, as well the graph itself. 1. (10 points). The data set kilotons.csv posted on Bb show, for each of 19 Soviet nuclear weapons tests, the seismic disturbance (Richter scale) detected in the west at the time and the actual blast yields (kilotons) provided by the Soviets after the (first) cold war thawed. Input the data into R, creating a data frame. Provide me the commands you used and enter Isl) with response to prove to me that it exists in your workspace. Then construct a scatter plot of the data, with a title and well-labeled axes (include units of measurement). Include your name in the title. Then, add a smooth exponential curve given by the equation exp(-14) *exp(3.12*x) Provide me the commands you used to construct your final graph, as well the graph itself
Step by Step Solution
There are 3 Steps involved in it

Get step-by-step solutions from verified subject matter experts