

Question: please use R code 2. Data on household vehicle miles of travel (VMT) are compiled annually by the Federal Highway Administration. A researcher is interested

please use R code
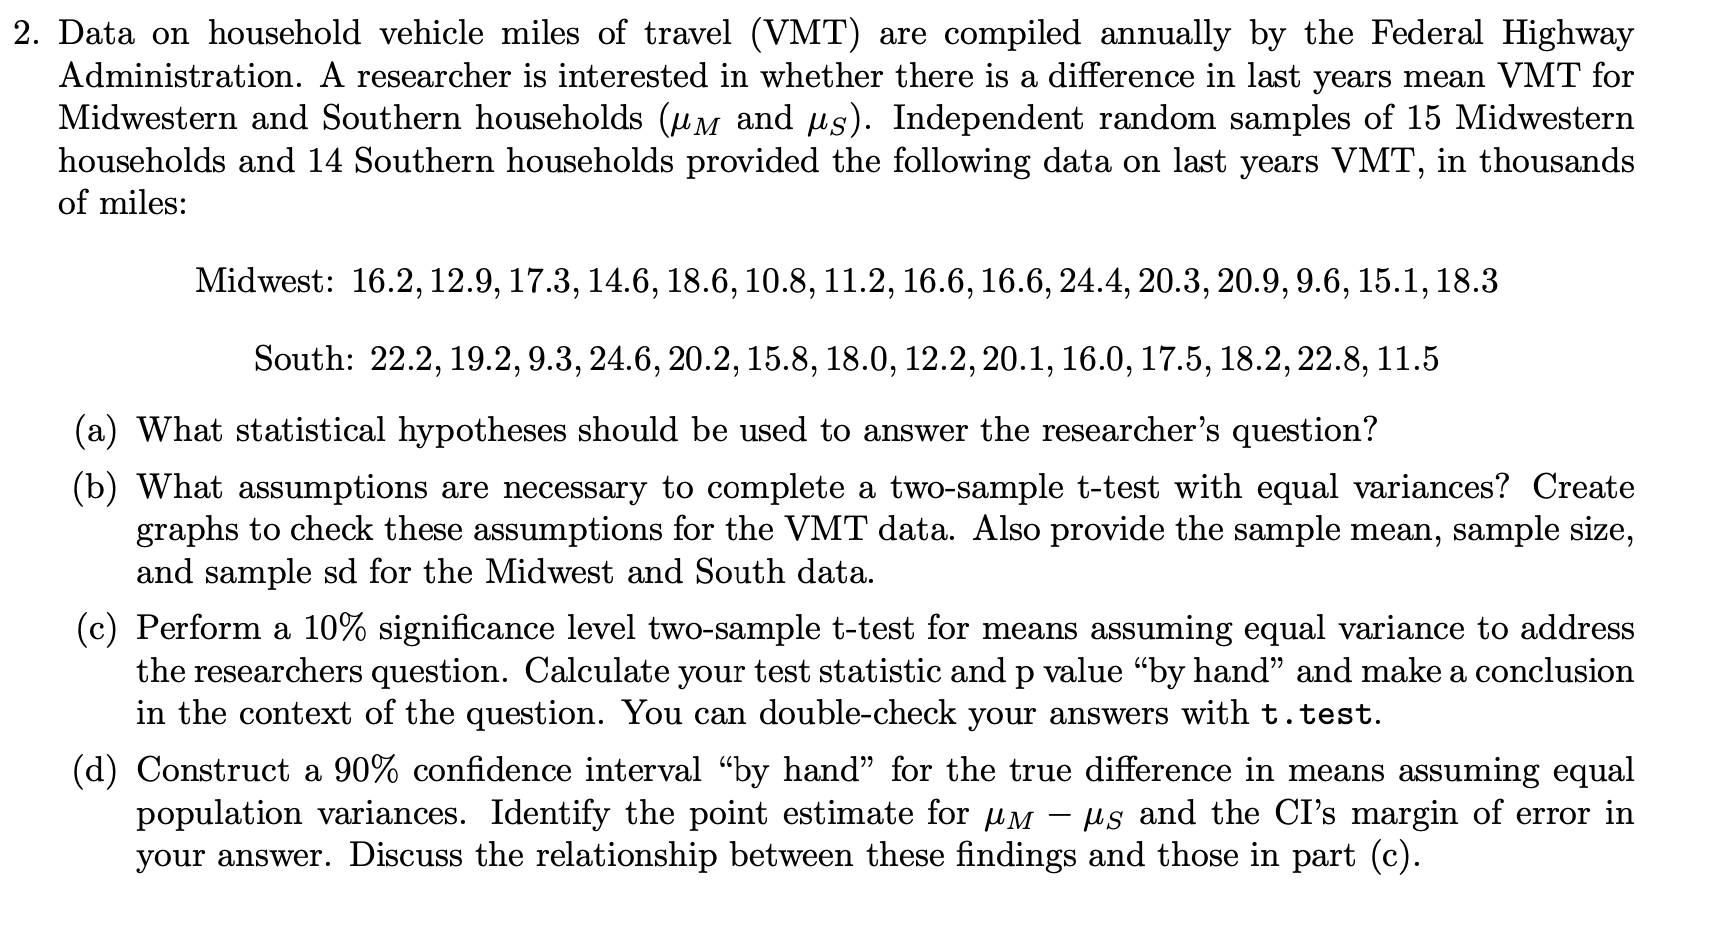
2. Data on household vehicle miles of travel (VMT) are compiled annually by the Federal Highway Administration. A researcher is interested in whether there is a difference in last years mean VMT for Midwestern and Southern households (UM and us). Independent random samples of 15 Midwestern households and 14 Southern households provided the following data on last years VMT, in thousands of miles: Midwest: 16.2, 12.9, 17.3, 14.6, 18.6, 10.8, 11.2, 16.6, 16.6, 24.4, 20.3, 20.9, 9.6, 15.1, 18.3 South: 22.2, 19.2, 9.3, 24.6, 20.2, 15.8, 18.0, 12.2, 20.1, 16.0, 17.5, 18.2, 22.8, 11.5 (a) What statistical hypotheses should be used to answer the researcher's question? (b) What assumptions are necessary to complete a two-sample t-test with equal variances? Create graphs to check these assumptions for the VMT data. Also provide the sample mean, sample size, and sample sd for the Midwest and South data. (c) Perform a 10% significance level two-sample t-test for means assuming equal variance to address the researchers question. Calculate your test statistic and p value "by hand" and make a conclusion in the context of the question. You can double-check your answers with t . test. (d) Construct a 90% confidence interval "by hand" for the true difference in means assuming equal population variances. Identify the point estimate for MM - us and the CI's margin of error in your answer. Discuss the relationship between these findings and those in part (c)
Step by Step Solution
There are 3 Steps involved in it

Get step-by-step solutions from verified subject matter experts