

Question: please use r code Question 7 4 points Save Answer An analysis of variance was used to compare the mean number of customers per week
please use r code
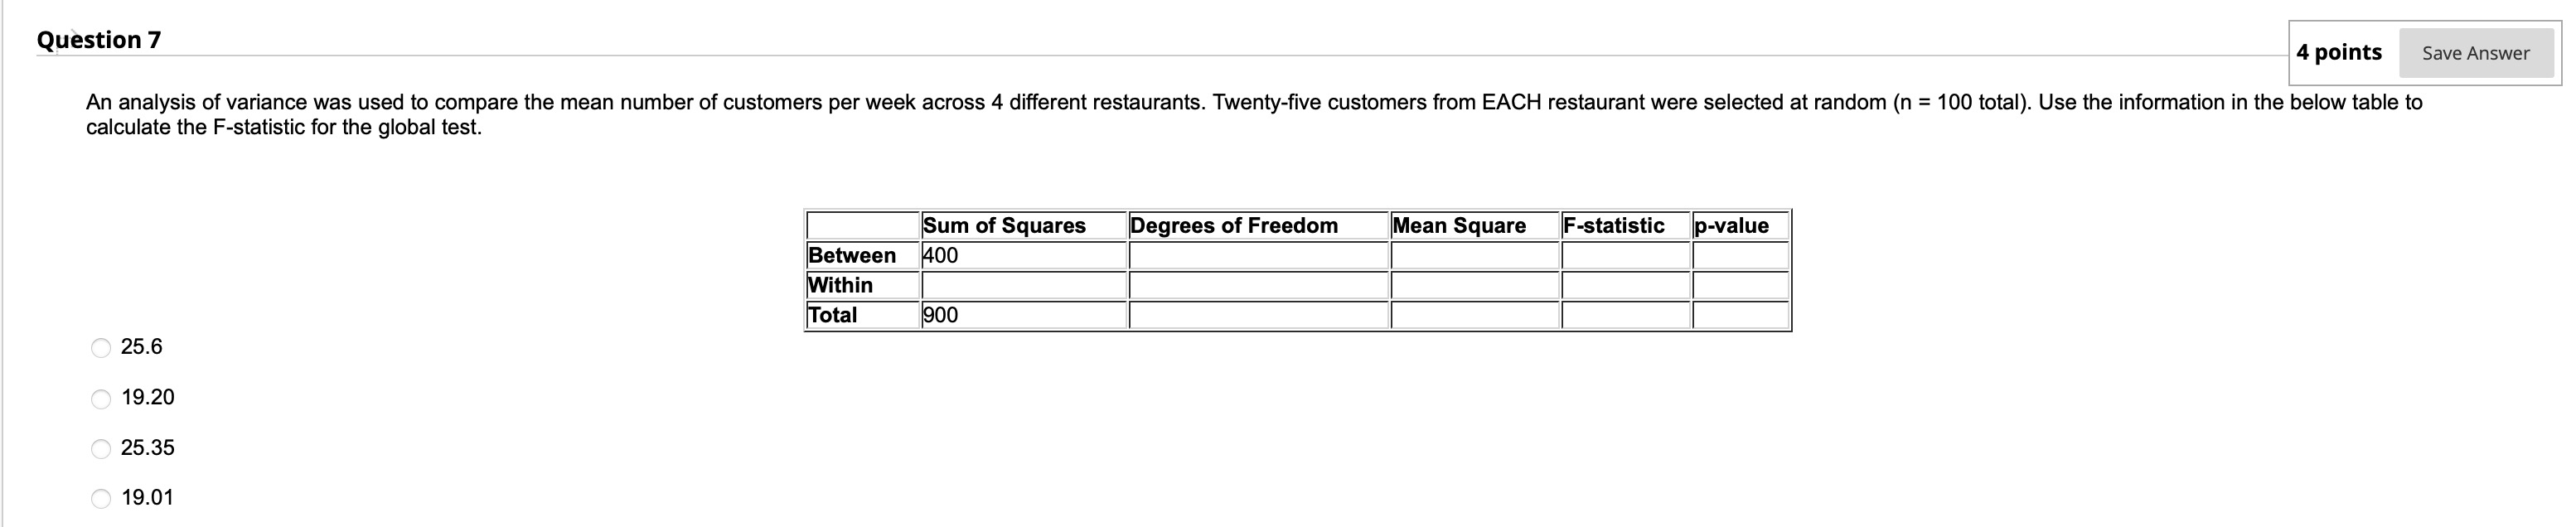
Question 7 4 points Save Answer An analysis of variance was used to compare the mean number of customers per week across 4 different restaurants. Twenty-five customers from EACH restaurant were selected at random (n = 100 total). Use the information in the below table to calculate the F-statistic for the global test Sum of Squares Degrees of Freedom Mean Square F-statistic p-value Between 400 Within Total 900 25.6 19.20 25.35 19.01
Step by Step Solution
There are 3 Steps involved in it
1 Expert Approved Answer
Step: 1 Unlock

Question Has Been Solved by an Expert!
Get step-by-step solutions from verified subject matter experts
Step: 2 Unlock
Step: 3 Unlock