

Question: Please use R for all calculations and coding 2. {a} Generate 20D random numbers from exponential distribution with rate A = 2. The parameter A
Please use R for all calculations and coding
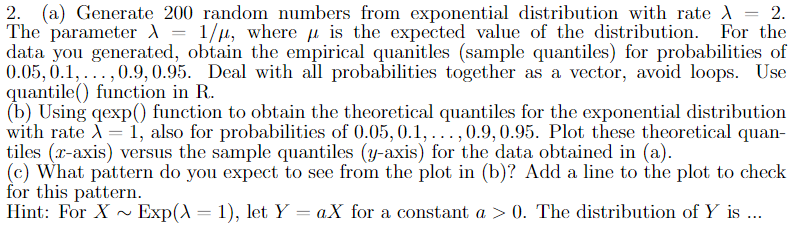
2. {a} Generate 20D random numbers from exponential distribution with rate A = 2. The parameter A = 1 fit, Where p. is the expected value of the distribution. For the data you generated, obtain the empirical quanitles [sample quantiles) for probabilities of U.UE,U.1,. . . .035}, [1.95. Deal with all probabilities together as a vector, avoid loops. Use quantileO function in R. (b) Using qexp function to obtain the theoretical quantiles for the exponential distribution with rate A = 1, also for probabilities of [1.05, [3.11 .. . , [1.9, 0.95. Plot these theoretical quan tiles (zaxjs) versus the sample quantiles (jgaxis} for the data obtained in (a). {c} What pattern do you expect to see from the plot in {b}? Add a line to the plot to check for this pattern. Hint: For X N Exp{A = 1),, let Y = oX for a constant a :3 U. The distribution of Y is
Step by Step Solution
There are 3 Steps involved in it

Get step-by-step solutions from verified subject matter experts