

Question: Please use same chart format for better understanding. Last line is the totals. Wormwood, Ltd., produces a variety of furniture products. The planning committee wants
Please use same chart format for better understanding.
Last line is the totals.
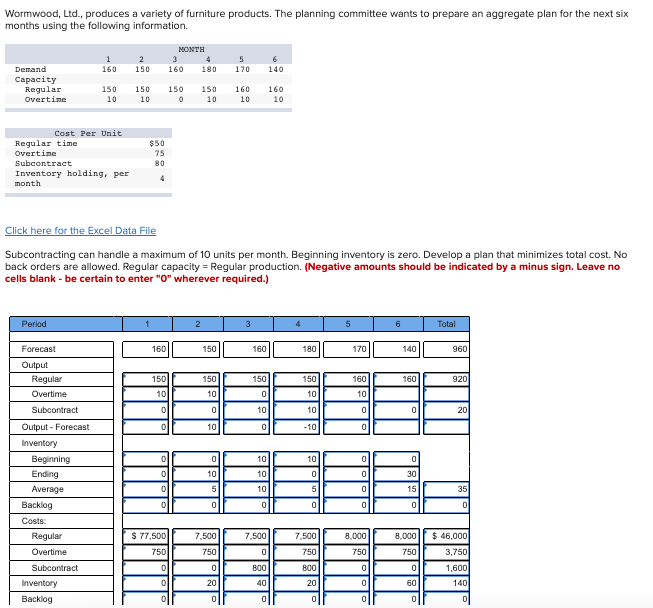
Wormwood, Ltd., produces a variety of furniture products. The planning committee wants to prepare an aggregate plan for the next six months using the following information. 1 160 2 150 MONTH 3 4 160 180 5 170 140 Demand Capacity Regular Overtime 160 150 10 150 10 150 0 150 10 160 10 10 Cost Per Unit Regular time Overtime Subcontract Inventory holding, per month $50 75 80 4 Click here for the Excel Data File Subcontracting can handle a maximum of 10 units per month. Beginning inventory is zero. Develop a plan that minimizes total cost. No back orders are allowed. Regular capacity = Regular production. (Negative amounts should be indicated by a minus sign. Leave no cells blank - be certain to enter "0" wherever required.) Period 2 5 6 Total 160 150 160 180 170 140 960 150 150 150 150 160 160 920 10 10 0 10 10 0 0 10 10 0 0 20 0 10 0 -10 0 0 10 0 0 Forecast Output Regular Overtime Subcontract Output - Forecast Inventory Beginning Ending Average Backlog Costs: Regular Overtime Subcontract Inventory Backlog 10 10 0 0 0 30 10 5 0 10 5 0 15 35 0 0 0 0 0 0 0 7.500 8.000 $ 77,500 750 7.500 0 7,500 750 8,000 750 750 750 $ 46,000 3,750 1,600 140 0 0 800 800 0 0 0 20 40 20 0 60 0 0 0 0 0 0 0Step by Step Solution
There are 3 Steps involved in it
1 Expert Approved Answer
Step: 1 Unlock

Question Has Been Solved by an Expert!
Get step-by-step solutions from verified subject matter experts
Step: 2 Unlock
Step: 3 Unlock