

Question: Please use the Aggregated Planning Level method orders of each of the company's five mills. The demand forecast (thousands of board feet) for the next
 Please use the Aggregated Planning Level method
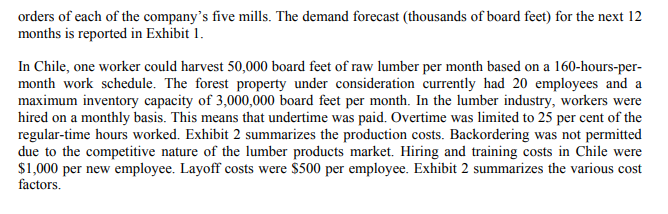
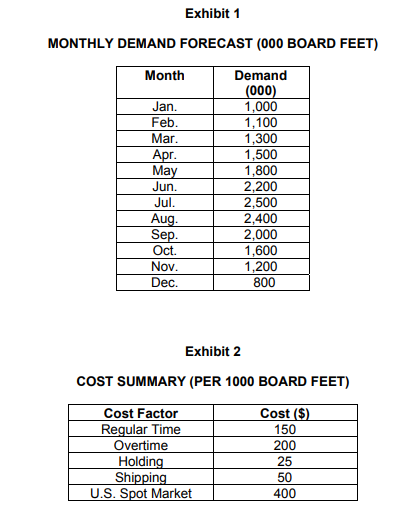
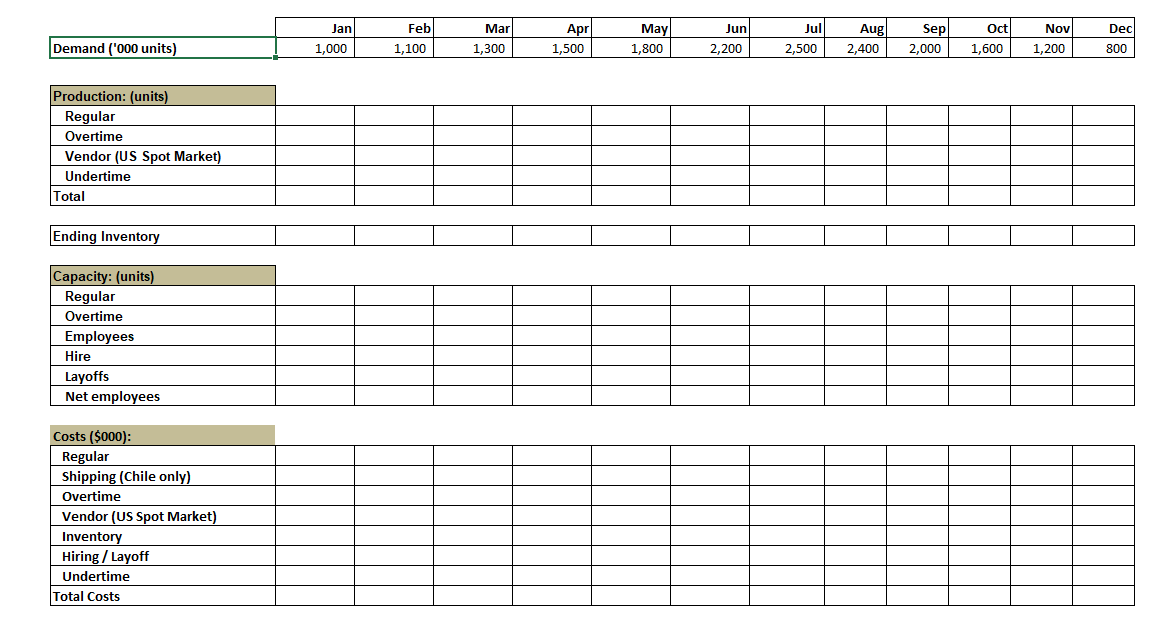
orders of each of the company's five mills. The demand forecast (thousands of board feet) for the next 12 months is reported in Exhibit 1. In Chile, one worker could harvest 50,000 board feet of raw lumber per month based on a 160-hours-per- month work schedule. The forest property under consideration currently had 20 employees and a maximum inventory capacity of 3,000,000 board feet per month. In the lumber industry, workers were hired on a monthly basis. This means that undertime was paid. Overtime was limited to 25 per cent of the regular-time hours worked. Exhibit 2 summarizes the production costs. Backordering was not permitted due to the competitive nature of the lumber products market. Hiring and training costs in Chile were $1,000 per new employee. Layoff costs were $500 per employee. Exhibit 2 summarizes the various cost factors. Exhibit 1 MONTHLY DEMAND FORECAST (000 BOARD FEET) Month Jan. Feb. Mar. Apr. May Jun. Jul. Aug. Sep Oct. Nov. Dec. Demand (000) 1,000 1,100 1,300 1,500 1,800 2,200 2,500 2,400 2,000 1,600 1,200 800 Exhibit 2 COST SUMMARY (PER 1000 BOARD FEET) Cost Factor Regular Time Overtime Holding Shipping U.S. Spot Market Cost ($) 150 200 25 50 400 Jan 1,000 Feb 1,100 Mar 1,300 Apr 1,500 May 1,800 Jun 2,200 Jul 2,500 Aug 2,400 Sep 2,000 Oct 1,600 Nov 1,200 Dec 800 Demand ('000 units) Production: (units) Regular Overtime Vendor (US Spot Market) Undertime Total Ending Inventory Capacity: (units) Regular Overtime Employees Hire Layoffs Net employees Costs ($000): Regular Shipping (Chile only) Overtime Vendor (US Spot Market) Inventory Hiring / Layoff Undertime Total Costs orders of each of the company's five mills. The demand forecast (thousands of board feet) for the next 12 months is reported in Exhibit 1. In Chile, one worker could harvest 50,000 board feet of raw lumber per month based on a 160-hours-per- month work schedule. The forest property under consideration currently had 20 employees and a maximum inventory capacity of 3,000,000 board feet per month. In the lumber industry, workers were hired on a monthly basis. This means that undertime was paid. Overtime was limited to 25 per cent of the regular-time hours worked. Exhibit 2 summarizes the production costs. Backordering was not permitted due to the competitive nature of the lumber products market. Hiring and training costs in Chile were $1,000 per new employee. Layoff costs were $500 per employee. Exhibit 2 summarizes the various cost factors. Exhibit 1 MONTHLY DEMAND FORECAST (000 BOARD FEET) Month Jan. Feb. Mar. Apr. May Jun. Jul. Aug. Sep Oct. Nov. Dec. Demand (000) 1,000 1,100 1,300 1,500 1,800 2,200 2,500 2,400 2,000 1,600 1,200 800 Exhibit 2 COST SUMMARY (PER 1000 BOARD FEET) Cost Factor Regular Time Overtime Holding Shipping U.S. Spot Market Cost ($) 150 200 25 50 400 Jan 1,000 Feb 1,100 Mar 1,300 Apr 1,500 May 1,800 Jun 2,200 Jul 2,500 Aug 2,400 Sep 2,000 Oct 1,600 Nov 1,200 Dec 800 Demand ('000 units) Production: (units) Regular Overtime Vendor (US Spot Market) Undertime Total Ending Inventory Capacity: (units) Regular Overtime Employees Hire Layoffs Net employees Costs ($000): Regular Shipping (Chile only) Overtime Vendor (US Spot Market) Inventory Hiring / Layoff Undertime Total Costs
Step by Step Solution
There are 3 Steps involved in it

Get step-by-step solutions from verified subject matter experts