Question: Please use the chart below to answer the following: Y= __ + ____X How many patients will be seen in year 11? How many patients

Please use the chart below to answer the following:

Y= __ + ____X

How many patients will be seen in year 11?

How many patients will be seen in year 12?

Is there a strong relationship between number of patients and year?Please use the chart below to answer the

Dr. Lillian Fok, a New Orleans psychologist, specializes in treating patients who are agoraphobic (i.e., afraid to leave their homes). The following table indicates how many patients Dr. Fok has seen each year for the past 10 years. It also indicates what the robbery rate was in New Orleans during the same year. Year Number of Patients Robbery Rate per 1,000 Population where y = Dependent Variable and x = Independent Variable 2 34 58.3 60.6 1 37 3 39 73.0 76.1 4 42 5 41 6 56 81.5 89.0 The simple linear regression equation that shows the best relationship between the number of patients and year is (round your responses to three decimal places): y=+* 7 60 99.6 8 53 95.4 9 58 102.2 10 60 P 116.2

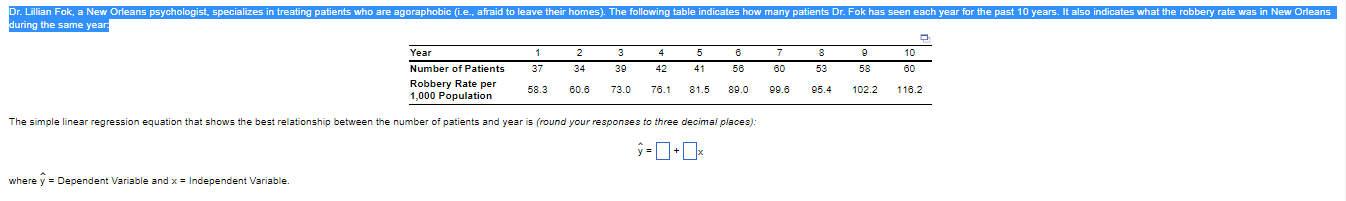
Step by Step Solution

There are 3 Steps involved in it

1 Expert Approved Answer
Step: 1 Unlock blur-text-image
Question Has Been Solved by an Expert!

Get step-by-step solutions from verified subject matter experts

Step: 2 Unlock
Step: 3 Unlock

Students Have Also Explored These Related General Management Questions!