

Question: Please use the chart provide and show formulas on how to calculate the blank IRR sections. Optimistic Most Likely Pessimistic Mean Value 1100 210 10
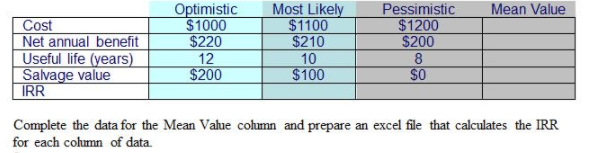
Please use the chart provide and show formulas on how to calculate the blank IRR sections.
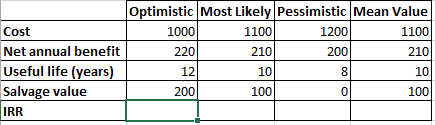
Optimistic Most Likely Pessimistic Mean Value 1100 210 10 100 1200 Cost Net annual benefit Useful life (years) Salvage value 1000 220 12 200 1100 210 10 100 C) IRR
Step by Step Solution
There are 3 Steps involved in it
1 Expert Approved Answer
Step: 1 Unlock

Question Has Been Solved by an Expert!
Get step-by-step solutions from verified subject matter experts
Step: 2 Unlock
Step: 3 Unlock