

Question: please use the chart to solve both part A and B. I dont know what I am doing wrong. Refer the table below on the
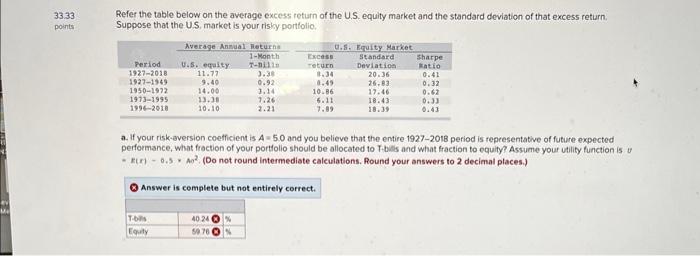
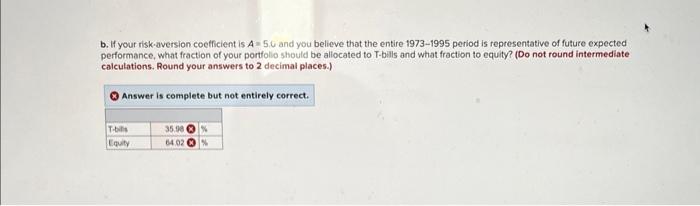
Refer the table below on the average excess return of the U.S. equity market and the standard deviation of that excess return. Suppose that the US, market is your rishy portfolio. a. If your risk-aversion coefficient is A=50 and you believe that the entire 19272018 period is representative of future expected performance, what froction of your portfolio should be allocated to Thils and what fraction to equity? Assume your utility function is ut - r(x) 0.5=A02. (Do not round intermediate caleulations. Round your answers to 2 decimal places.) Answer is complete but not entirely cerrect. b. If your risk-aversion coefficient is A=5.6 and you believe that the entire 19731995 period is representative of future expected performance, what fraction of your portfolio should be aliocated to T-bills and what fraction to equity? (Do not round intermediate calculations. Round your answers to 2 decimal places.) Answer is complete but not entirely correct
Step by Step Solution
There are 3 Steps involved in it

Get step-by-step solutions from verified subject matter experts