

Question: Please use the data from figure 1 to answer the following questions. Please show your work to demonstrate the proper calculations. Round all calculations to
Please use the data from figure to answer the following questions. Please show your work to demonstrate the proper calculations. Round all calculations to one decimal place.
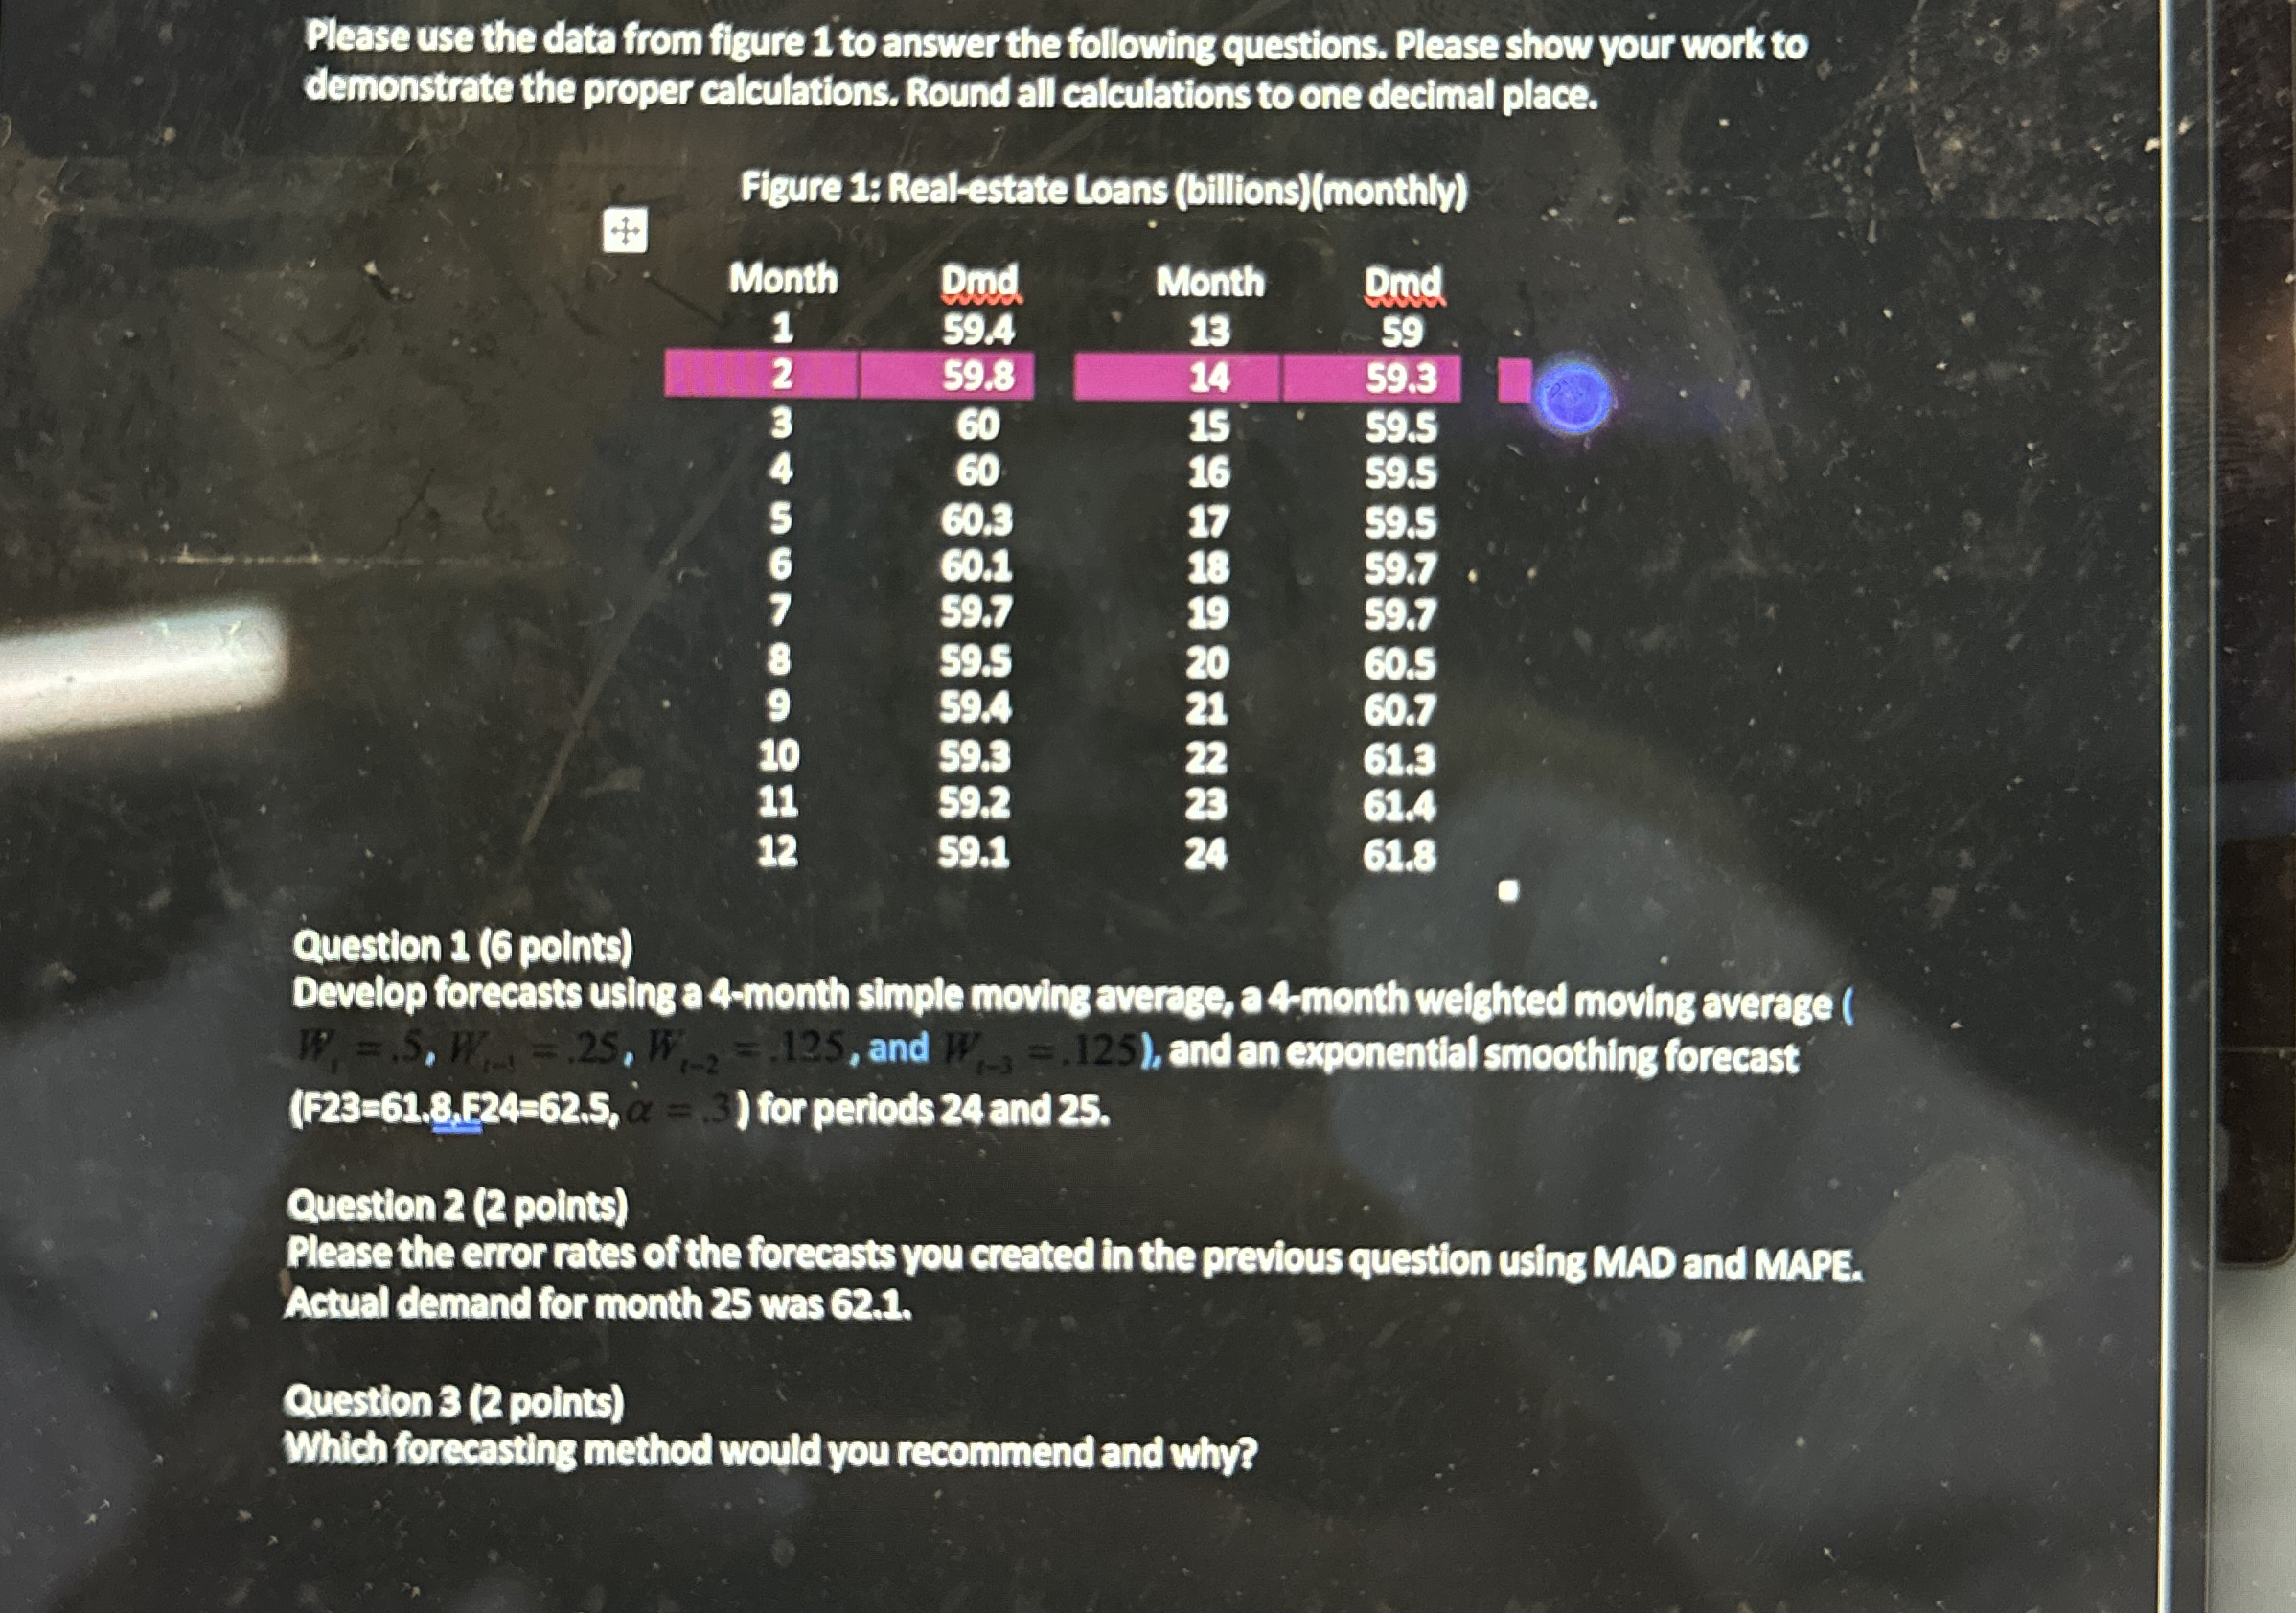
Figure : Realestate Loans billionsmonthly
tableMonthDud,Month,Dud
Question points
Develop forecasts using a month simple moving averge, a month weighted moving average and : and an exponental smoothing forecast for periods and
Question points
Please the error rates of the forecasts you created in the previous question using MAD and MAPE. Actual demand for month was
Question points
Which forecasting method would you recommend and why?
Step by Step Solution
There are 3 Steps involved in it
1 Expert Approved Answer
Step: 1 Unlock

Question Has Been Solved by an Expert!
Get step-by-step solutions from verified subject matter experts
Step: 2 Unlock
Step: 3 Unlock