

Question: Please use the Excel template to calculate the cells highlighted in orange. Exhibit P8-12.1 Earthlink (ELINK) 159,399,000 $ 10.00 $1,593,990,000 $ 900,000 $ 0 Microsoft
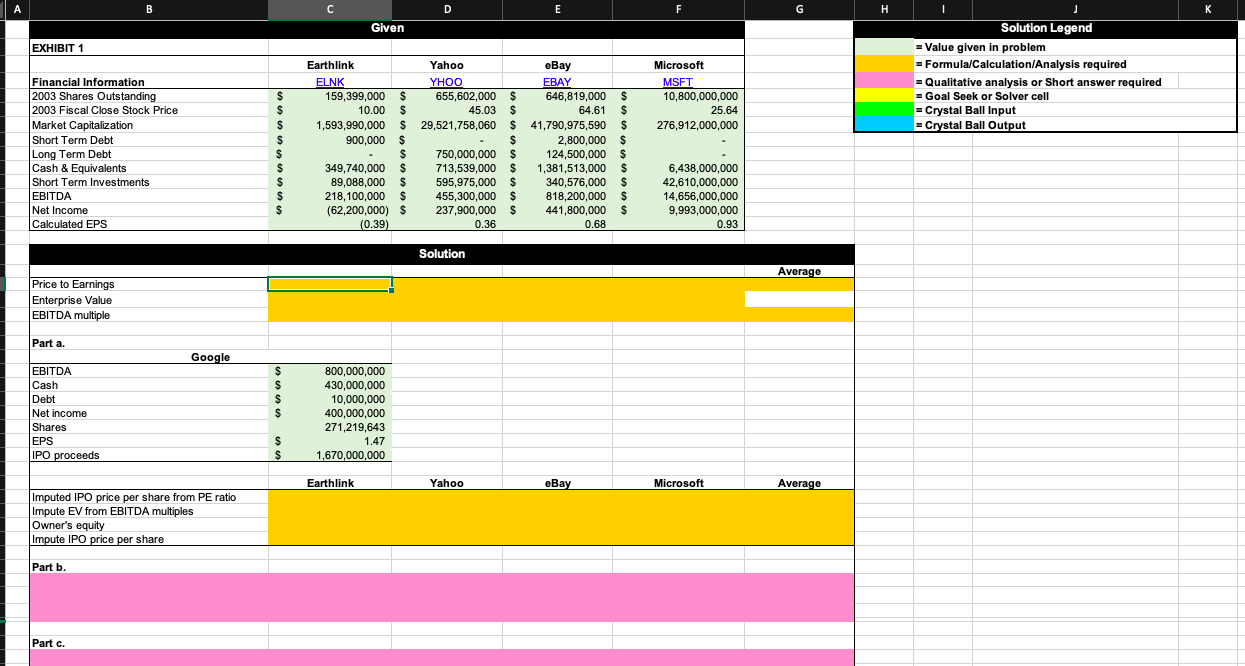
Please use the Excel template to calculate the cells highlighted in orange.
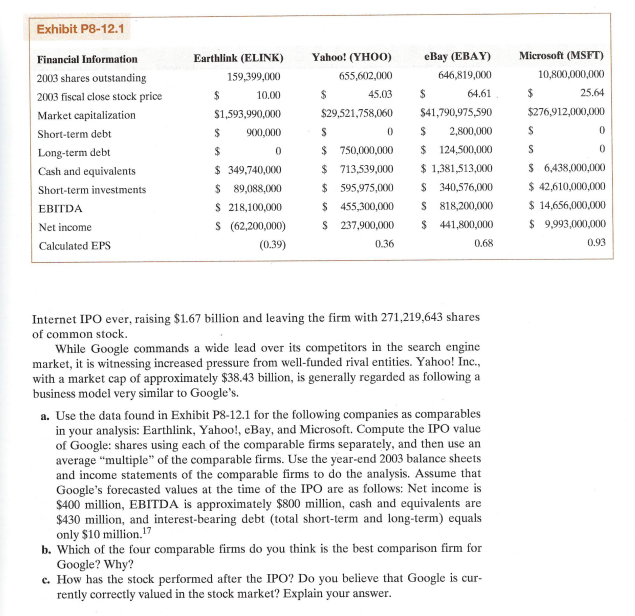
Exhibit P8-12.1 Earthlink (ELINK) 159,399,000 $ 10.00 $1,593,990,000 $ 900,000 $ 0 Microsoft (MSFT) 10,800,000,000 $ 25.64 $276,912,000,000 S 0 Yahoo! (YHOO) 655,602,000 $ 45.03 $29,521,758,060 $ 0 $ 750,000,000 $ 713,539,000 $ 595,975,000 $ 455,300,000 Financial Information 2003 shares outstanding 2003 fiscal close stock price Market capitalization Short-term debt Long-term debt Cash and equivalents Short-term investments EBITDA Net income Calculated EPS eBay (EBAY) 646,819,000 $ 64.61 $41,790,975,590 S 2,800,000 $ 124,500,000 $ 1,381,513,000 $ 340,576,000 S 818,200,000 $ 441,800,000 0.68 S 0 $ 349,740,000 $ 89,088,000 $ 218,100,000 $ (62,200,000) (0.39) $ 6,438,000,000 $ 42,610,000,000 $ 14,656,000,000 $ 9,993,000,000 0.93 $ 237,900,000 0.36 Internet IPO ever, raising $1.67 billion and leaving the firm with 271,219,643 shares of common stock. While Google commands a wide lead over its competitors in the search engine market, it is witnessing increased pressure from well-funded rival entities. Yahoo! Inc., with a market cap of approximately $38.43 billion, is generally regarded as following a business model very similar to Google's. a. Use the data found in Exhibit P8-12.1 for the following companies as comparables in your analysis: Earthlink, Yahoo!, eBay, and Microsoft Compute the IPO value of Google: shares using each of the comparable firms separately, and then use an average "multiple" of the comparable firms. Use the year-end 2003 balance sheets and income statements of the comparable firms to do the analysis. Assume that Google's forecasted values at the time of the IPO are as follows: Net income is $400 million, EBITDA is approximately $800 million, cash and equivalents are $430 million, and interest-bearing debt (total short-term and long-term) equals only $10 million.17 b. Which of the four comparable firms do you think is the best comparison firm for Google? Why? c. How has the stock performed after the IPO? Do you believe that Google is cur- rently correctly valued in the stock market? Explain your answer. A B C D E F G H K Given EXHIBIT 1 Microsoft MSFT 10,800,000,000 25.64 276,912,000,000 J Solution Legend = Value given in problem = Formula/Calculation/Analysis required = Qualitative analysis or Short answer required - Goal Seek or Solver cell - Crystal Ball Input - Crystal Ball Output Financial Information 2003 Shares Outstanding 2003 Fiscal Close Stock Price Market Capitalization Short Term Debt Long Term Debt Cash & Equivalents Short Term Investments EBITDA Net Income Calculated EPS $ $ $ $ S $ $ $ S Earthlink ELNK 159,399,000 $ 10.00 $ 1,593,990,000 $ 900,000 $ 349,740,000 $ 89,088,000 $ 218,100,000 $ (62,200,000) $ (0.39) Yahoo YHOO 655,602,000 $ 45.03 $ 29,521,758,060 $ S 750,000,000 $ 713,539,000 $ 595,975,000 $ 455,300,000 $ 237,900,000 $ 0.36 eBay EBAY 646,819,000 $ 64.61 $ 41,790,975,590 $ 2,800,000 $ 124,500,000 $ 1,381,513,000 $ 340,576,000 $ 818,200,000 $ 441,800,000 $ 0.68 6,438,000,000 42,610,000,000 14,656,000,000 9,993,000,000 0.93 Solution Average Price to Earnings Enterprise Value EBITDA multiple Part a. Google EBITDA Cash Debt Net income Shares EPS IPO proceeds $ $ $ $ 800,000,000 430,000,000 10,000,000 400,000,000 271,219,643 1.47 $ $ 1,670,000,000 Earthlink Yahoo eBay Microsoft Average Imputed IPO price per share from PE ratio Impute EV from EBITDA multiples Owner's equity Impute IPO price per share Part b. Part c. Exhibit P8-12.1 Earthlink (ELINK) 159,399,000 $ 10.00 $1,593,990,000 $ 900,000 $ 0 Microsoft (MSFT) 10,800,000,000 $ 25.64 $276,912,000,000 S 0 Yahoo! (YHOO) 655,602,000 $ 45.03 $29,521,758,060 $ 0 $ 750,000,000 $ 713,539,000 $ 595,975,000 $ 455,300,000 Financial Information 2003 shares outstanding 2003 fiscal close stock price Market capitalization Short-term debt Long-term debt Cash and equivalents Short-term investments EBITDA Net income Calculated EPS eBay (EBAY) 646,819,000 $ 64.61 $41,790,975,590 S 2,800,000 $ 124,500,000 $ 1,381,513,000 $ 340,576,000 S 818,200,000 $ 441,800,000 0.68 S 0 $ 349,740,000 $ 89,088,000 $ 218,100,000 $ (62,200,000) (0.39) $ 6,438,000,000 $ 42,610,000,000 $ 14,656,000,000 $ 9,993,000,000 0.93 $ 237,900,000 0.36 Internet IPO ever, raising $1.67 billion and leaving the firm with 271,219,643 shares of common stock. While Google commands a wide lead over its competitors in the search engine market, it is witnessing increased pressure from well-funded rival entities. Yahoo! Inc., with a market cap of approximately $38.43 billion, is generally regarded as following a business model very similar to Google's. a. Use the data found in Exhibit P8-12.1 for the following companies as comparables in your analysis: Earthlink, Yahoo!, eBay, and Microsoft Compute the IPO value of Google: shares using each of the comparable firms separately, and then use an average "multiple" of the comparable firms. Use the year-end 2003 balance sheets and income statements of the comparable firms to do the analysis. Assume that Google's forecasted values at the time of the IPO are as follows: Net income is $400 million, EBITDA is approximately $800 million, cash and equivalents are $430 million, and interest-bearing debt (total short-term and long-term) equals only $10 million.17 b. Which of the four comparable firms do you think is the best comparison firm for Google? Why? c. How has the stock performed after the IPO? Do you believe that Google is cur- rently correctly valued in the stock market? Explain your answer. A B C D E F G H K Given EXHIBIT 1 Microsoft MSFT 10,800,000,000 25.64 276,912,000,000 J Solution Legend = Value given in problem = Formula/Calculation/Analysis required = Qualitative analysis or Short answer required - Goal Seek or Solver cell - Crystal Ball Input - Crystal Ball Output Financial Information 2003 Shares Outstanding 2003 Fiscal Close Stock Price Market Capitalization Short Term Debt Long Term Debt Cash & Equivalents Short Term Investments EBITDA Net Income Calculated EPS $ $ $ $ S $ $ $ S Earthlink ELNK 159,399,000 $ 10.00 $ 1,593,990,000 $ 900,000 $ 349,740,000 $ 89,088,000 $ 218,100,000 $ (62,200,000) $ (0.39) Yahoo YHOO 655,602,000 $ 45.03 $ 29,521,758,060 $ S 750,000,000 $ 713,539,000 $ 595,975,000 $ 455,300,000 $ 237,900,000 $ 0.36 eBay EBAY 646,819,000 $ 64.61 $ 41,790,975,590 $ 2,800,000 $ 124,500,000 $ 1,381,513,000 $ 340,576,000 $ 818,200,000 $ 441,800,000 $ 0.68 6,438,000,000 42,610,000,000 14,656,000,000 9,993,000,000 0.93 Solution Average Price to Earnings Enterprise Value EBITDA multiple Part a. Google EBITDA Cash Debt Net income Shares EPS IPO proceeds $ $ $ $ 800,000,000 430,000,000 10,000,000 400,000,000 271,219,643 1.47 $ $ 1,670,000,000 Earthlink Yahoo eBay Microsoft Average Imputed IPO price per share from PE ratio Impute EV from EBITDA multiples Owner's equity Impute IPO price per share Part b. Part c
Step by Step Solution
There are 3 Steps involved in it

Get step-by-step solutions from verified subject matter experts