

Question: Please use the excel template to submit your answer. 2. Frozen cranberry-apple juice concentrate is packed in 6-oz cardboard cans. These cans are formed on
Please use the excel template to submit your answer.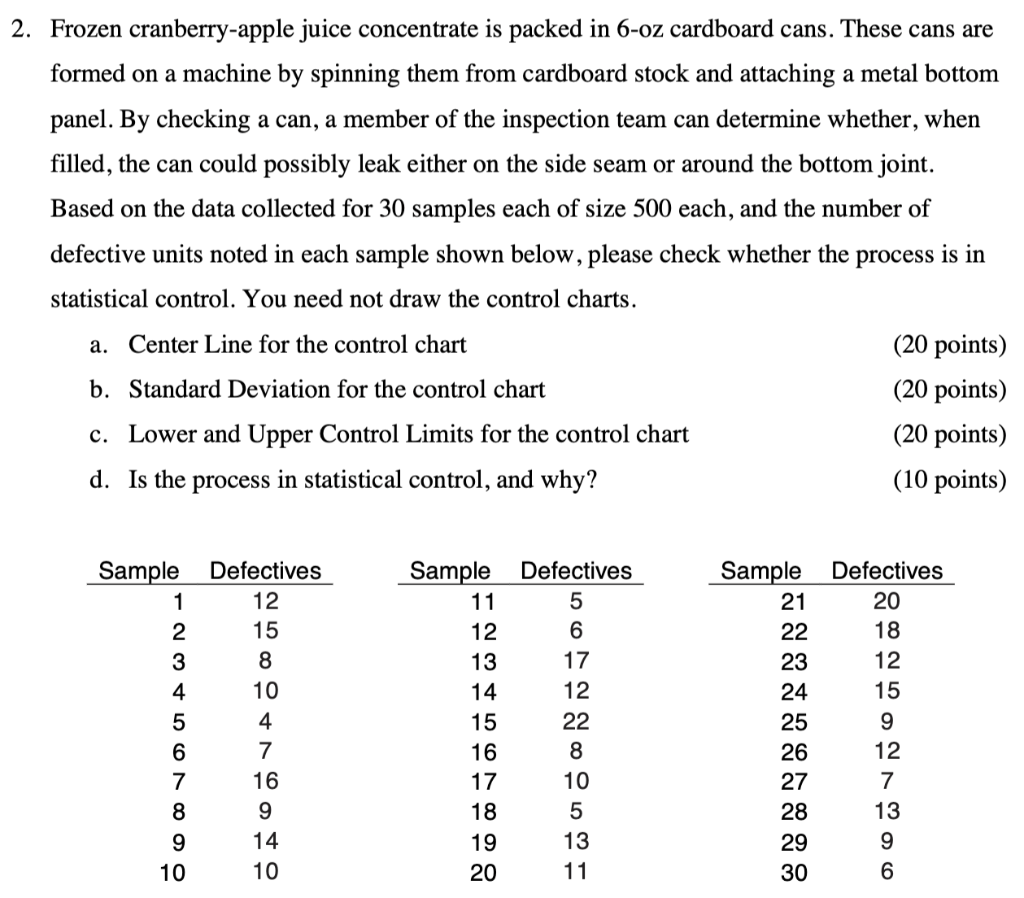
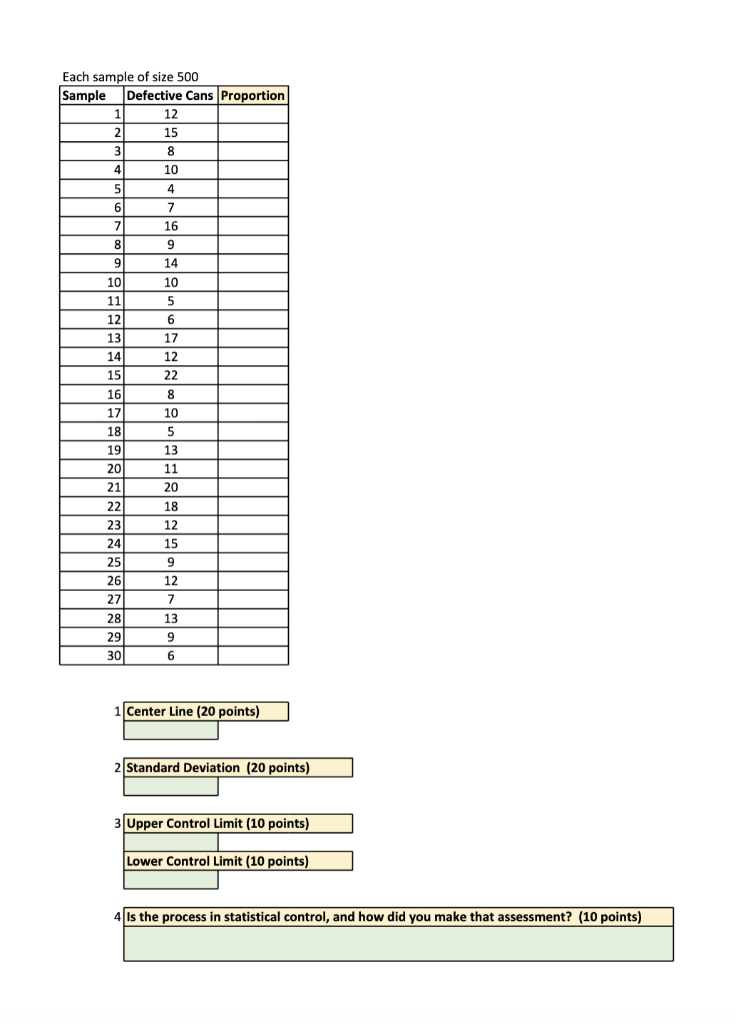
2. Frozen cranberry-apple juice concentrate is packed in 6-oz cardboard cans. These cans are formed on a machine by spinning them from cardboard stock and attaching a metal bottom panel. By checking a can, a member of the inspection team can determine whether, when filled, the can could possibly leak either on the side seam or around the bottom joint. Based on the data collected for 30 samples each of size 500 each, and the number of defective units noted in each sample shown below, please check whether the process is in statistical control. You need not draw the control charts. a. Center Line for the control chart (20 points) b. Standard Deviation for the control chart (20 points) c. Lower and Upper Control Limits for the control chart (20 points) d. Is the process in statistical control, and why? (10 points) 1 1 i 1 \begin{tabular}{|l|l|} \hline Upper Control Limit (10 points) \\ \hline Lower Control Limit (10 points) \\ \hline \end{tabular} 2. Frozen cranberry-apple juice concentrate is packed in 6-oz cardboard cans. These cans are formed on a machine by spinning them from cardboard stock and attaching a metal bottom panel. By checking a can, a member of the inspection team can determine whether, when filled, the can could possibly leak either on the side seam or around the bottom joint. Based on the data collected for 30 samples each of size 500 each, and the number of defective units noted in each sample shown below, please check whether the process is in statistical control. You need not draw the control charts. a. Center Line for the control chart (20 points) b. Standard Deviation for the control chart (20 points) c. Lower and Upper Control Limits for the control chart (20 points) d. Is the process in statistical control, and why? (10 points) 1 1 i 1 \begin{tabular}{|l|l|} \hline Upper Control Limit (10 points) \\ \hline Lower Control Limit (10 points) \\ \hline \end{tabular}
Step by Step Solution
There are 3 Steps involved in it

Get step-by-step solutions from verified subject matter experts