

Question: Cont. from previous questions. 4. Please compute the standard deviation of the control chart and determine the control limits UCL and LCL. Don't forget to
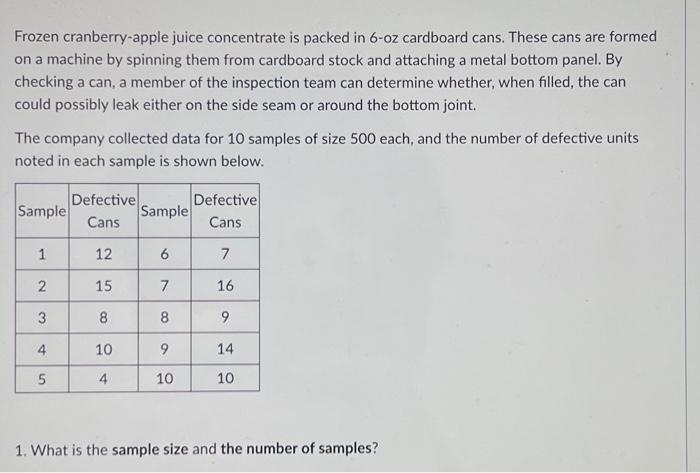
Cont. from previous questions. 4. Please compute the standard deviation of the control chart and determine the control limits UCL and LCL. Don't forget to show your work. Cont. from previous questions. 2. What is the sample proportion, i.e., the fraction of defective units, of sample 1 and sample 2 ? Don't forget to show your work. Frozen cranberry-apple juice concentrate is packed in 6-oz cardboard cans. These cans are formed on a machine by spinning them from cardboard stock and attaching a metal bottom panel. By checking a can, a member of the inspection team can determine whether, when filled, the can could possibly leak either on the side seam or around the bottom joint. The company collected data for 10 samples of size 500 each, and the number of defective units noted in each sample is shown below. 1. What is the sample size and the number of samples? Cont. from previous questions. 3. Please identify the center line of the control chart, i.e., the average performance p bar. Don't forget to show your work. Cont. from previous questions. 5. Is the process in statistical control, and how did you make that assessment? Don't forget to show your work
Step by Step Solution
There are 3 Steps involved in it

Get step-by-step solutions from verified subject matter experts