

Question: Please use the file which provides the data to answer the problems 1-3. Problem 1) The time Students entered the classroom of OM 390, Introductory
Please use the file which provides the data to answer the problems 1-3.
Problem 1) The time Students entered the classroom of OM 390, Introductory Operations Management, was recorded by the professor in the table below for five class meetings. Create and provide a histogram of these data by using excel. Analyze the histogram, what is it telling us? Please note that a negative time means that the student arrived after the start of class.
Problem 2) Using the data from the preceding problem, the instructor in charge of these five classes strongly feels that the arrival patterns are strongly influenced by the class (i.e., the arrival rates vary by class). Create and provide a histogram for each class separately. Do the data support this position?
Problem 3) Using the data from problem 1, create and provide an overall cause-and-effect chart explaining why students arrived so early.
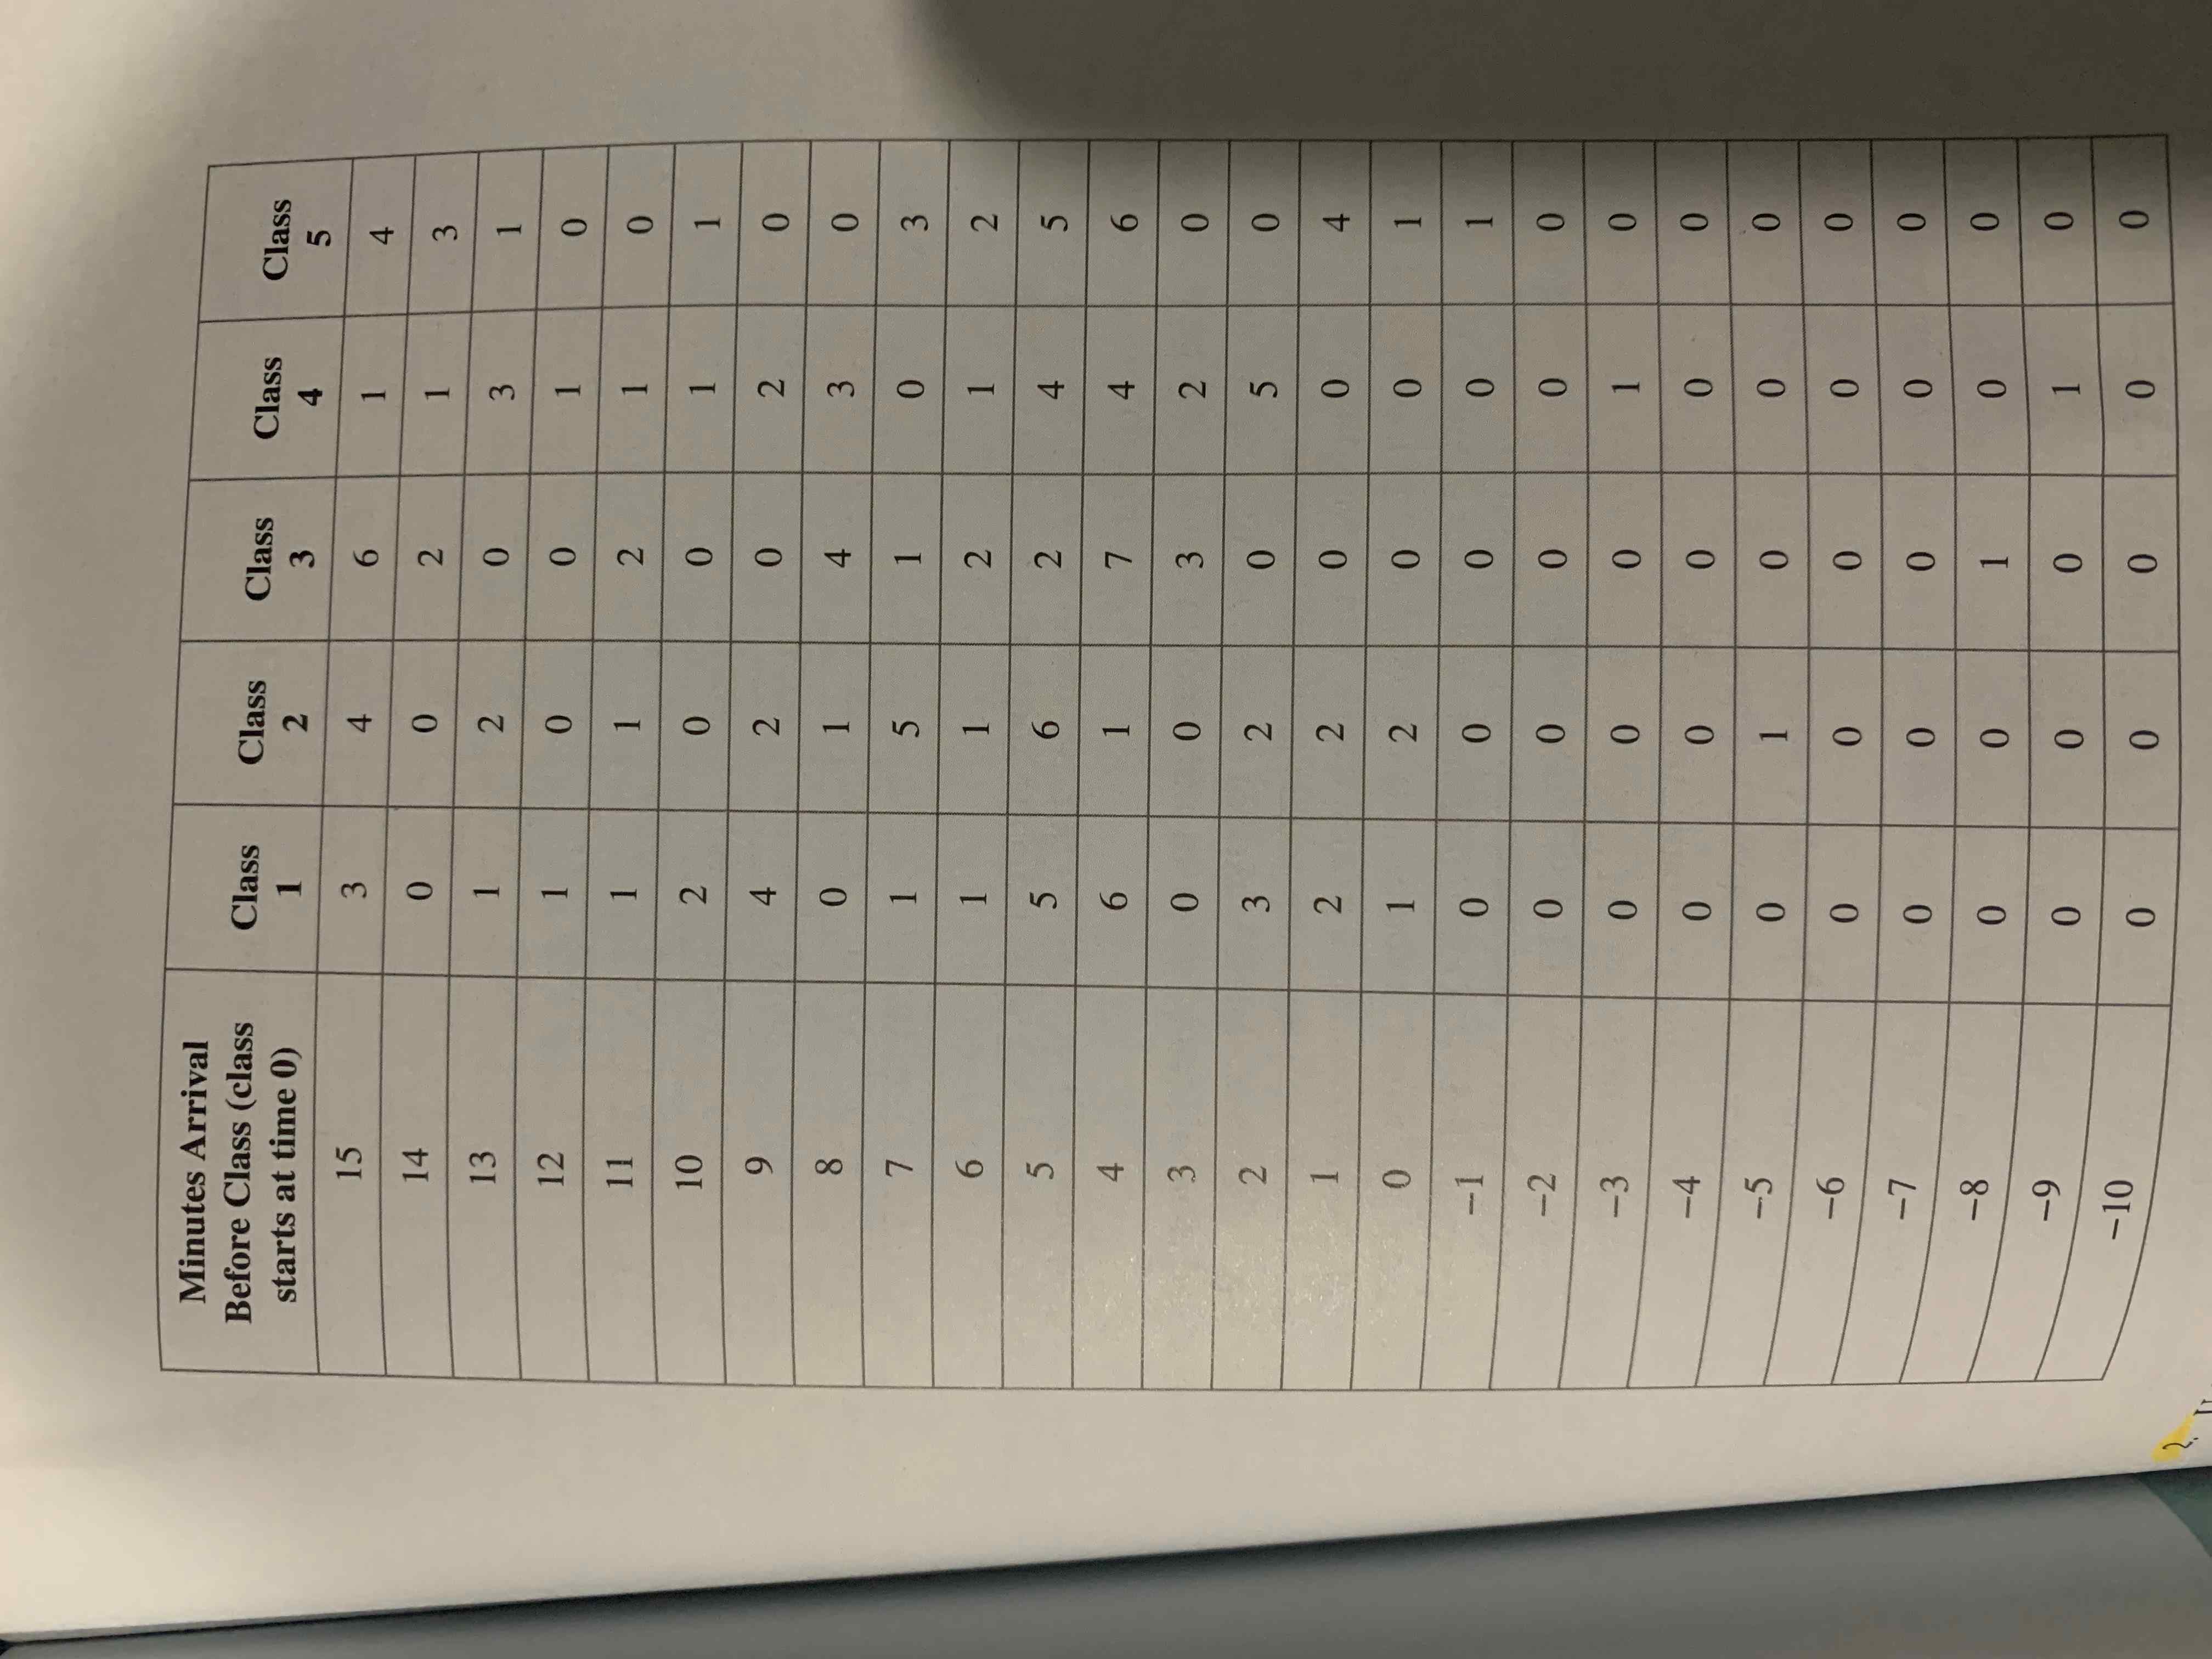
Minutes Arrival Before Class (class Class Class Class Class Class starts at time 0) 1 2 3 4 5 15 3 4 6 1 4 14 0 13 1 02 2 1 3 0 3 1 12 1 0 0 1 0 11 1 1 2 1 0 10 2 0 0 1 1 9 2 0 2 0 8 0 1 4 3 0 7 1 5 1 0 3 6 1 1 2 1 2 5 5 6 2 4 5 4 6 1 7 4 6 3 0 0 3 2 0 2 3 2 0 5 0 1 2 2 0 0 4 0 1 2 0 0 1 -1 0 0 0 0 1 -2 0 0 0 0 0 -3 0 0 0 1 0 -4 0 0 0 0 0 -5 0 1 0 0 0 -6 0 0 0 0 0 -7 0 0 0 0 0 -8 0 0 1 0 0 -9 0 0 0 1 0 -10 0 0 0 0 0 2.
Step by Step Solution
There are 3 Steps involved in it
First Ill convert the table data into a format suitable for creating a histogram in Excel Then Ill create the histogram and analyze it StepbyStep Data ... View full answer

Get step-by-step solutions from verified subject matter experts