

Question: Please use the following chart (below) IF NEEDED to answer the 2 questions below the chart. Please and Thank You!! Questions: Table of Control Chart
Please use the following chart (below) IF NEEDED to answer the 2 questions below the chart. Please and Thank You!!
Questions:
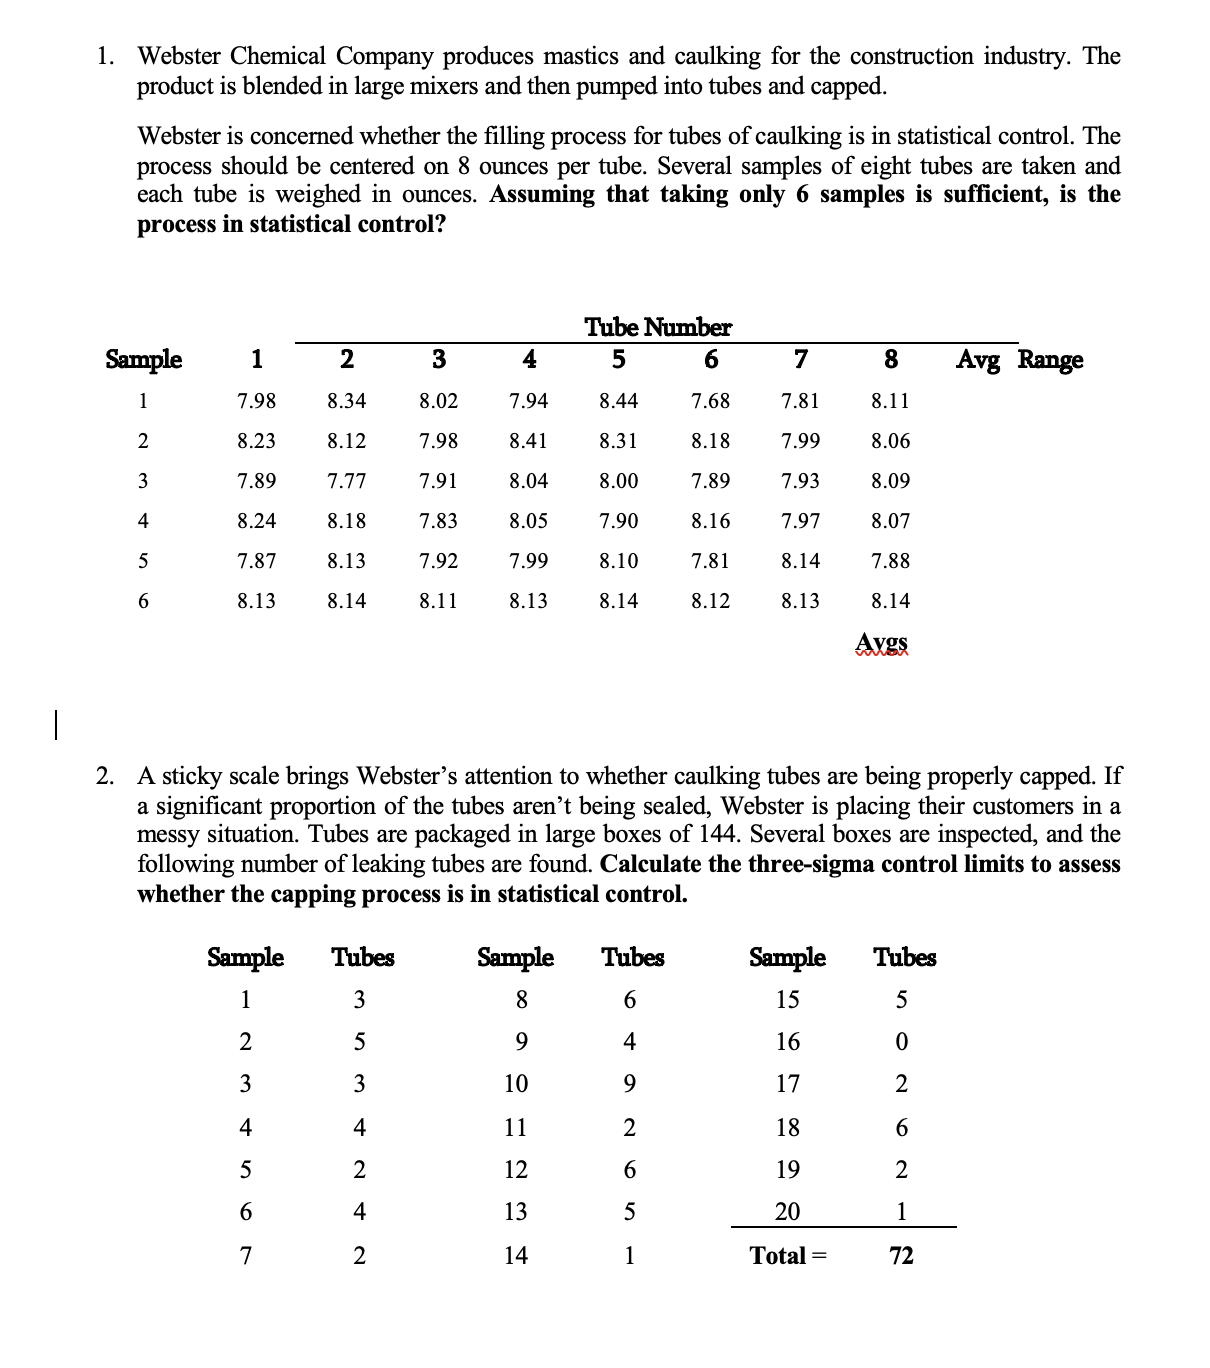
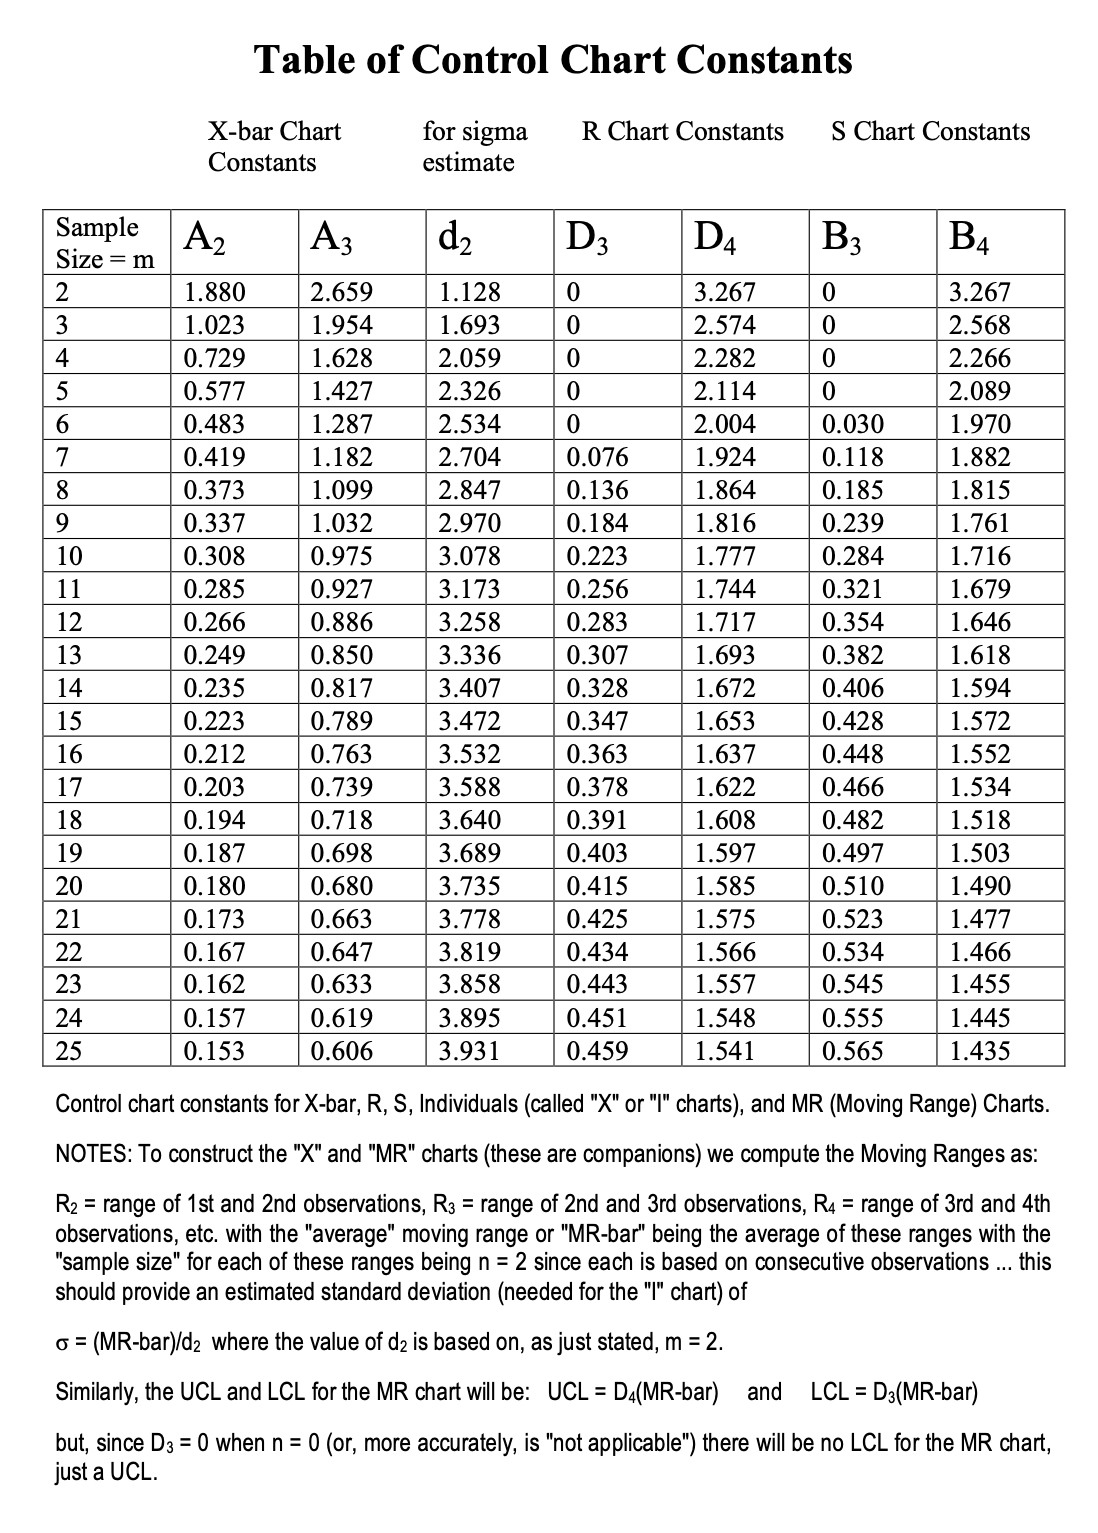
Table of Control Chart Constants X-bar Chart Constants for sigma estimate R Chart Constants S Chart Constants S Chart Constants Control chart constants for X-bar, R, S, Individuals (called "X" or "I" charts), and MR (Moving Range) Charts. NOTES: To construct the " X" and "MR" charts (these are companions) we compute the Moving Ranges as: R2= range of 1st and 2nd observations, R3= range of 2nd and 3rd observations, R4= range of 3rd and 4 th observations, etc. with the "average" moving range or "MR-bar" being the average of these ranges with the "sample size" for each of these ranges being n=2 since each is based on consecutive observations ... this should provide an estimated standard deviation (needed for the "I" chart) of =(MRbar)/d2 where the value of d2 is based on, as just stated, m=2. Similarly, the UCL and LCL for the MR chart will be: UCL=D4(MR bar ) and LCL=D3(MR bar) but, since D3=0 when n=0 (or, more accurately, is "not applicable") there will be no LCL for the MR chart, just a UCL. 1. Webster Chemical Company produces mastics and caulking for the construction industry. The product is blended in large mixers and then pumped into tubes and capped. Webster is concerned whether the filling process for tubes of caulking is in statistical control. The process should be centered on 8 ounces per tube. Several samples of eight tubes are taken and each tube is weighed in ounces. Assuming that taking only 6 samples is sufficient, is the process in statistical control? 2. A sticky scale brings Webster's attention to whether caulking tubes are being properly capped. If a significant proportion of the tubes aren't being sealed, Webster is placing their customers in a messy situation. Tubes are packaged in large boxes of 144. Several boxes are inspected, and the following number of leaking tubes are found. Calculate the three-sigma control limits to assess whether the capping process is in statistical control
Step by Step Solution
There are 3 Steps involved in it

Get step-by-step solutions from verified subject matter experts