

Question: Please use the following data to answer the questions. The ticker symbols are for Tesla Inc (TSLA), Barrick Gold Corporation (GOLD) and Apple Inc (AAPL).
Please use the following data to answer the questions. The ticker symbols are for Tesla Inc (TSLA), Barrick Gold Corporation (GOLD) and Apple Inc (AAPL). The prices shown are the closing stock prices for the date shown. Your first task is to compute the monthly holding period returns for each stock for each month, using the Holding Period Return formula, which is HPR = (P1-P0)/P0, where P1 is the end of period price and P0 is the start of period price. Be very careful to not mix up your dates. After you have computed the HPRs, then answer the following ten questions.
What is the arithmetic mean of the monthly stock returns for TSLA?
14.6%
15.7%
16.1%
22.35%
12.2%
What is the geometric mean of the monthly stock returns for TSLA?
12.5%
19.0%
12.9%
13.6%
Assume you have a portfolio of $20,000, invested 60% in TSLA and 40% in GOLD. What return would you expect for the portfolio, using the formula for portfolio return?
15.6%
11.5%
11.0%
12.2%
Assume you have a portfolio of $20,000, invested 60% in TSLA and 40% in GOLD. What was the sample standard deviation of the portfolio?
17.1%
15.6%
20.8%
16.8%
18.9%
Now assume that your portfolio is invested 40% in TSLA, 30% in GOLD and 30% in AAPL. What return would you expect for this portfolio?
9.4%
10.6%
12.24%
2.3%
What is the sample standard deviation of the portfolio comprised of 40% TSLA, 30% GOLD and 30% AAPL? Use the Variance/Covariance Matrix to assist in this calculation. You can find it on the last page.
17.1%
13.8%
13.5%
14.9%
12.4%
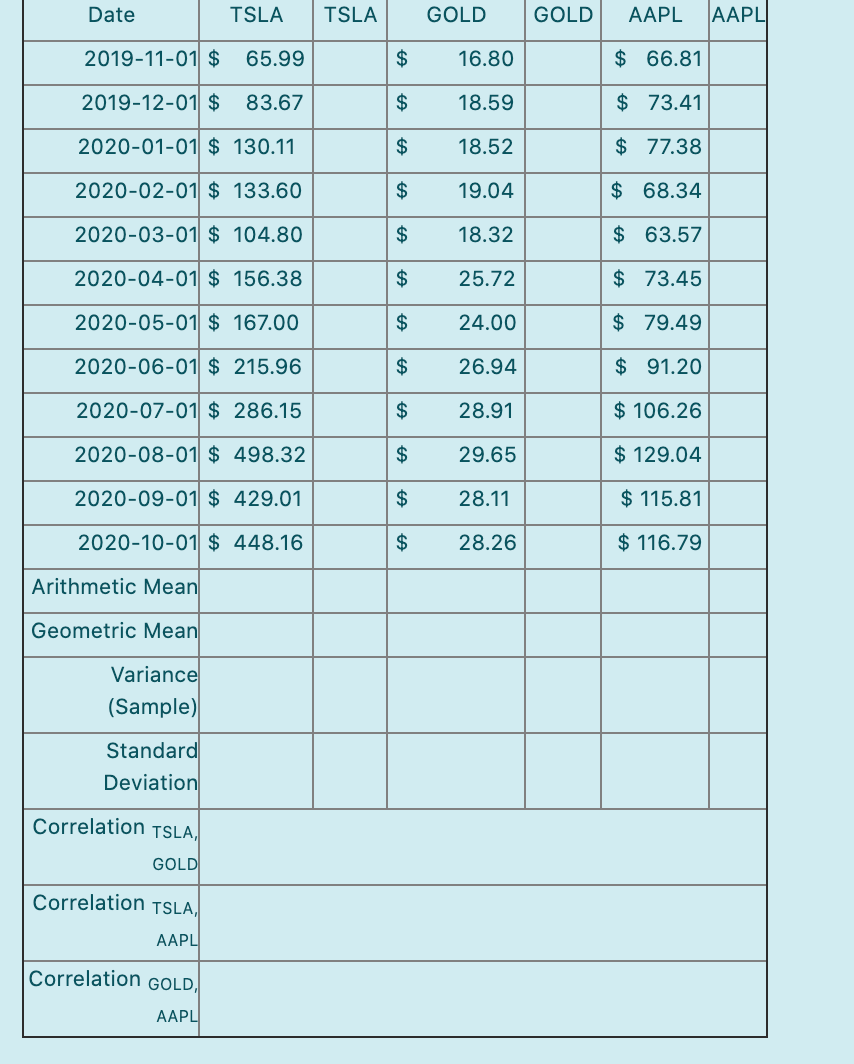
Date TSLA TSLA GOLD GOLD AAPL AAPL 2019-11-01 $ 65.99 GA 16.80 $ 66.81 2019-12-01 $ 83.67 $ 18.59 $ 73.41 2020-01-01 $ 130.11 $ 18.52 $ 77.38 2020-02-01 $ 133.60 $ 19.04 $ 68.34 2020-03-01 $ 104.80 $ 18.32 $ 63.57 2020-04-01 $ 156.38 $ 25.72 $ 73.45 2020-05-01 $ 167.00 $ 24.00 $ 79.49 2020-06-01 $ 215.96 $ 26.94 $ 91.20 2020-07-01 $ 286.15 $ 28.91 $ 106.26 2020-08-01 $ 498.32 $ 29.65 $ 129.04 2020-09-01 $ 429.01 $ 28.11 $ 115.81 2020-10-01 $ 448.16 $ 28.26 $ 116.79 Arithmetic Mean Geometric Mean Variance (Sample) Standard Deviation Correlation TSLA, GOLD Correlation TSLA, AAPL Correlation GOLD, AAPL
Step by Step Solution
There are 3 Steps involved in it

Get step-by-step solutions from verified subject matter experts