

Question: Please use the graphs provided to fill in the blanks. Complete this question by entering your answers in the tabs below. Required 1A Required 1B


Please use the graphs provided to fill in the blanks.

![December 31 Current Yr 1 1']: Age! 2 Yrs Ago Assets Cash](https://s3.amazonaws.com/si.experts.images/answers/2024/06/6676236f2d32d_3506676236ee19c4.jpg)
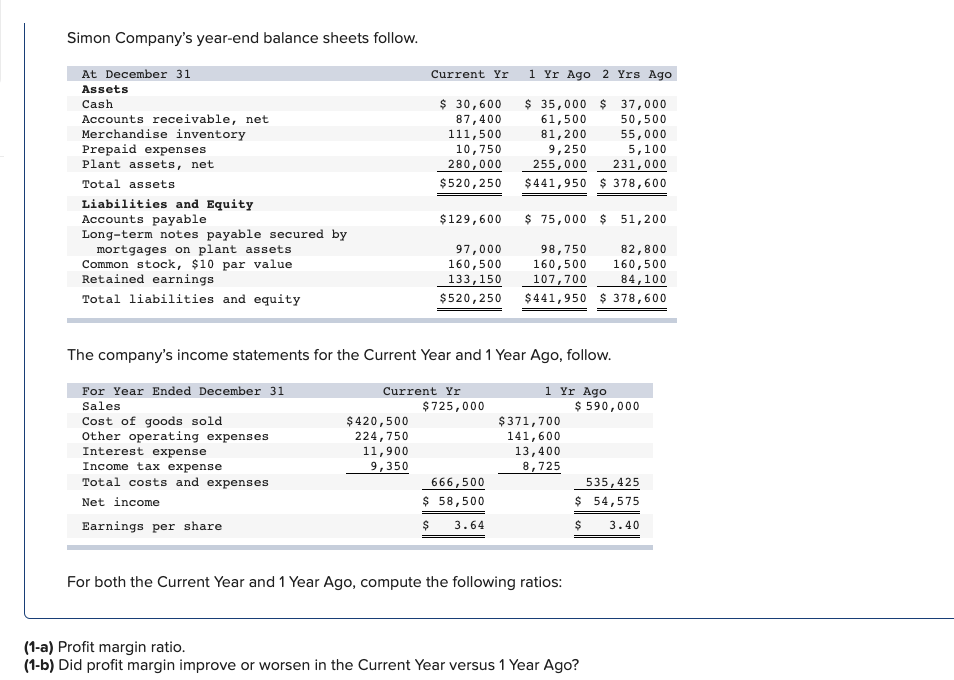
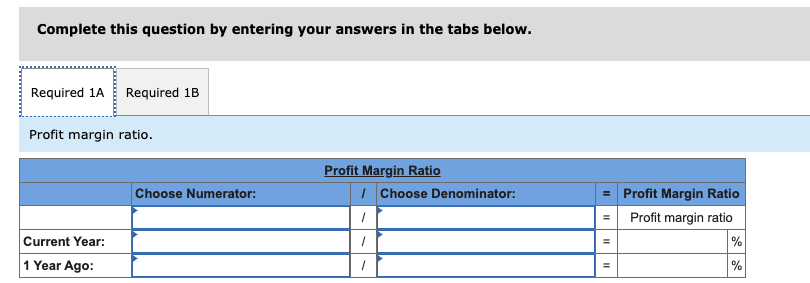
Complete this question by entering your answers in the tabs below. Required 1A Required 1B Profit margin ratio. Profit Margin Ratio Choose Numerator: 1 Choose Denominator: Profit Margin Ratio Profit margin ratio Current Year: S % 1 Year Ago: %Did profit margin improve or worsen in the Current Year versus 1 Year Ago? Profit marginSimon Company's year-end balance sheets follow. at December 31 Current Yr 1 1']: Age! 2 Yrs Ago Assets Cash 5 30,600 $ 35,000 5 37,000 Accounts receivable, net 37,400 61,500 50,500 Merchandise inventory 111,500 31,200 55,000 Prepaid expenses 10,?50 9,250 5,100 Plant: assets, net 230,000 255,000 231,000 Total assets $520,250 $441,950 $ 328,600 Liabilities and Equity Accounts payable $129,600 $ 25,000 $ 51,200 Long-term notes payable secured by mortgages on plant assets 97,000 98,?50 32,600 Common stock, $10 par value 160,500 160,500 160,500 Retained earnings 133,150 107,200 34,100 Total liabilities and equity $520,250 $441,950 $ 323,600 The company's income statements for the Current Year and 1 Year Ago, follow. Per Year Ended December 31 Current In: 1 1': Age Sales $125,000 $ 590, 000 Cost of goods sold $420,500 $321,200 other operating expenses 224,750 141,600 Interest expense 11,900 13,400 Income tax expense 9,350 3,225 Total costs and expenses 666,500 535,425 Net incmne $ 58,500 $ 54,5?5 Earnings per share $ 3.64 $ 3.40 For both the Current Year and 1 Year Ago, compute the following ratios: {1-a] Prot margin ratio. {1-b] Did prot margin improve or worsen in the Current Year versus 1 Year Ago?
Step by Step Solution
There are 3 Steps involved in it

Get step-by-step solutions from verified subject matter experts