

Question: Please use the matlab 7(a) There are initially 500 rabbits (x) and 200 foxes (y) on Farmer Oat's property. Use Polymath or MATLAB to plot
Please use the matlab
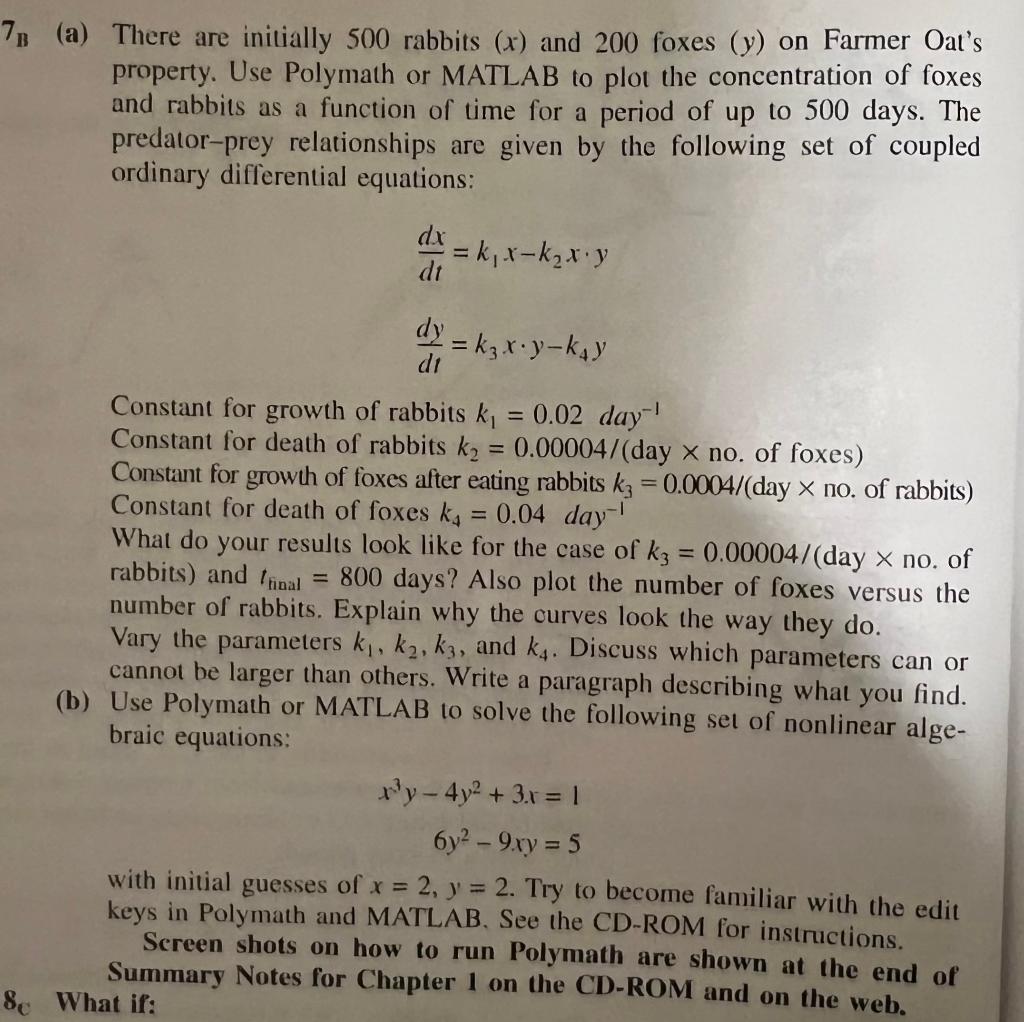
7(a) There are initially 500 rabbits (x) and 200 foxes (y) on Farmer Oat's property. Use Polymath or MATLAB to plot the concentration of foxes and rabbits as a function of time for a period of up to 500 days. The predator-prey relationships are given by the following set of coupled ordinary differential equations: dx = k, x-k t. y dt dy = kx. y-kay di = Constant for growth of rabbits k, = 0.02 day! Constant for death of rabbits k2 = 0.000047(day x no. of foxes) Constant for growth of foxes after eating rabbits kz = 0.0004/(day x no. of rabbits) Constant for death of foxes ka = 0.04 day! What do your results look like for the case of kz = 0.00004/(day x no. of rabbits) and final = 800 days? Also plot the number of foxes versus the number of rabbits. Explain why the curves look the way they do. Vary the parameters ki, k2, kz, and ks. Discuss which parameters can or cannot be larger than others. Write a paragraph describing what you find. (b) Use Polymath or MATLAB to solve the following set of nonlinear alge- braic equations: ry - 4y +31 = 1 6y2 - 9xy = 5 with initial guesses of x = 2, y = 2. Try to become familiar with the edit keys in Polymath and MATLAB. See the CD-ROM for instructions. Screen shots on how to run Polymath are shown at the end of Summary Notes for Chapter 1 on the CD-ROM and on the web. 8 What if
Step by Step Solution
There are 3 Steps involved in it

Get step-by-step solutions from verified subject matter experts