

Question: Please use this formula I provided to solve the questions. Answer in A4 papers. with eligible handwriting . Thanks. (CLO2:PLO4:C3)(CLO2:PLO7:C3) FORMULA SHEET Sturges Rule: No.
Please use this formula I provided to solve the questions. Answer in A4 papers. with eligible handwriting . Thanks.
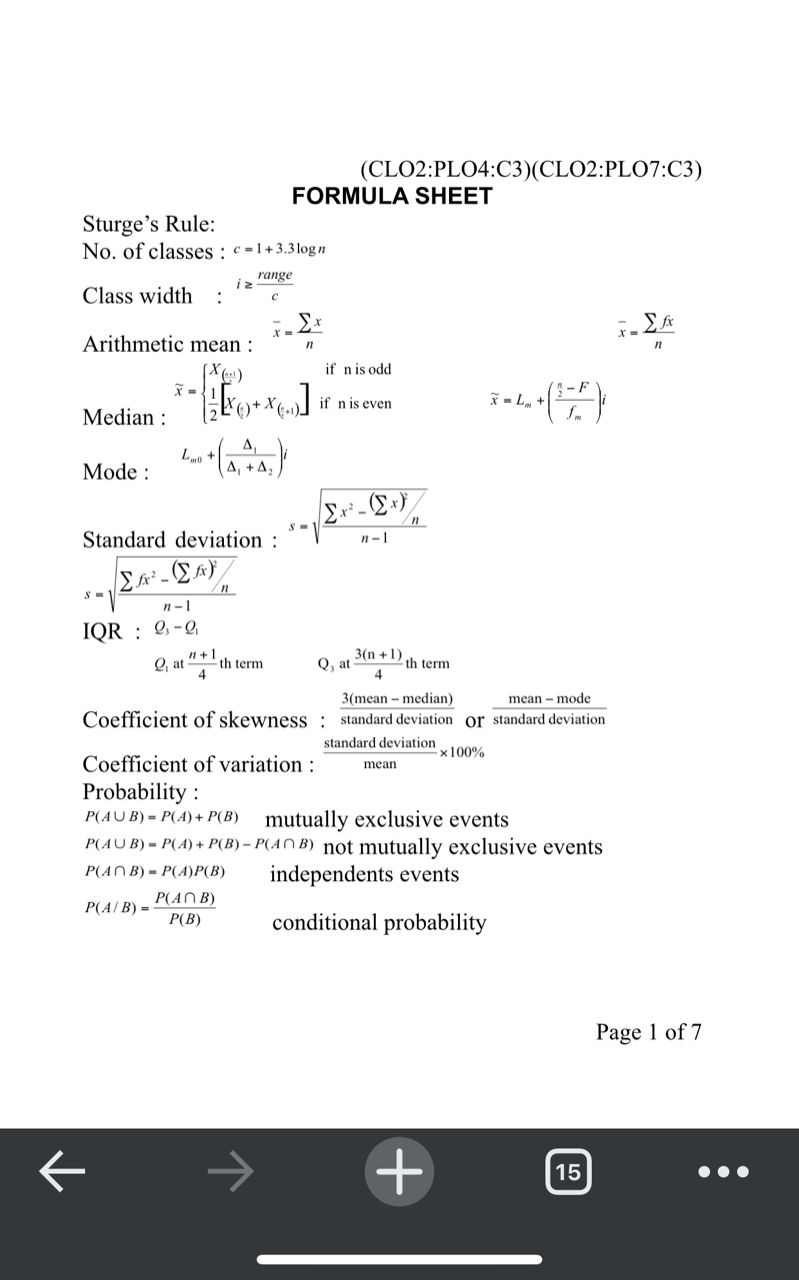
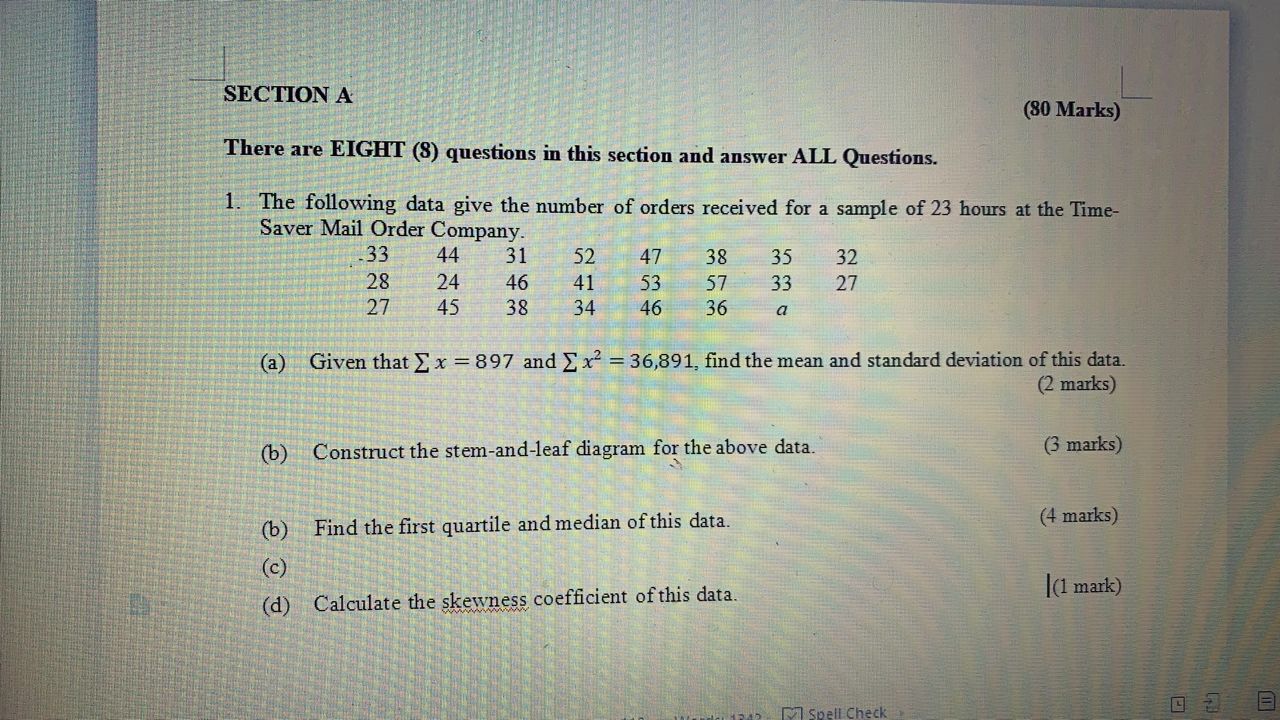
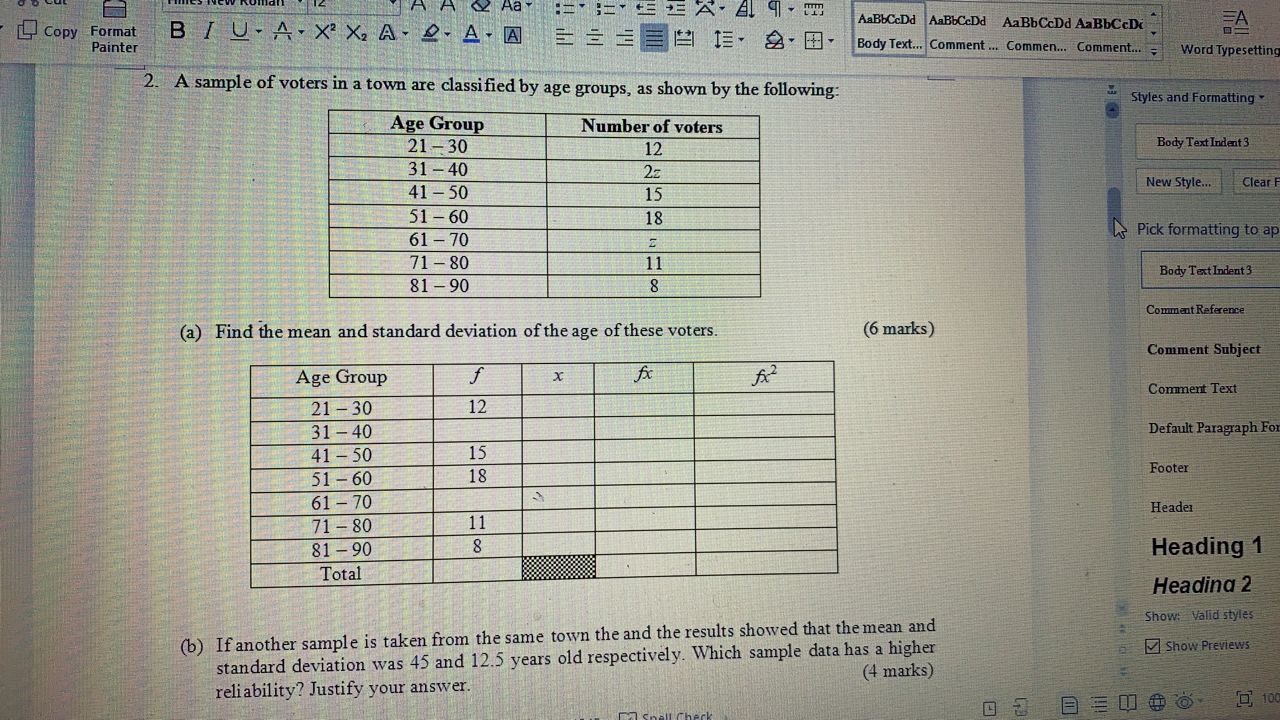
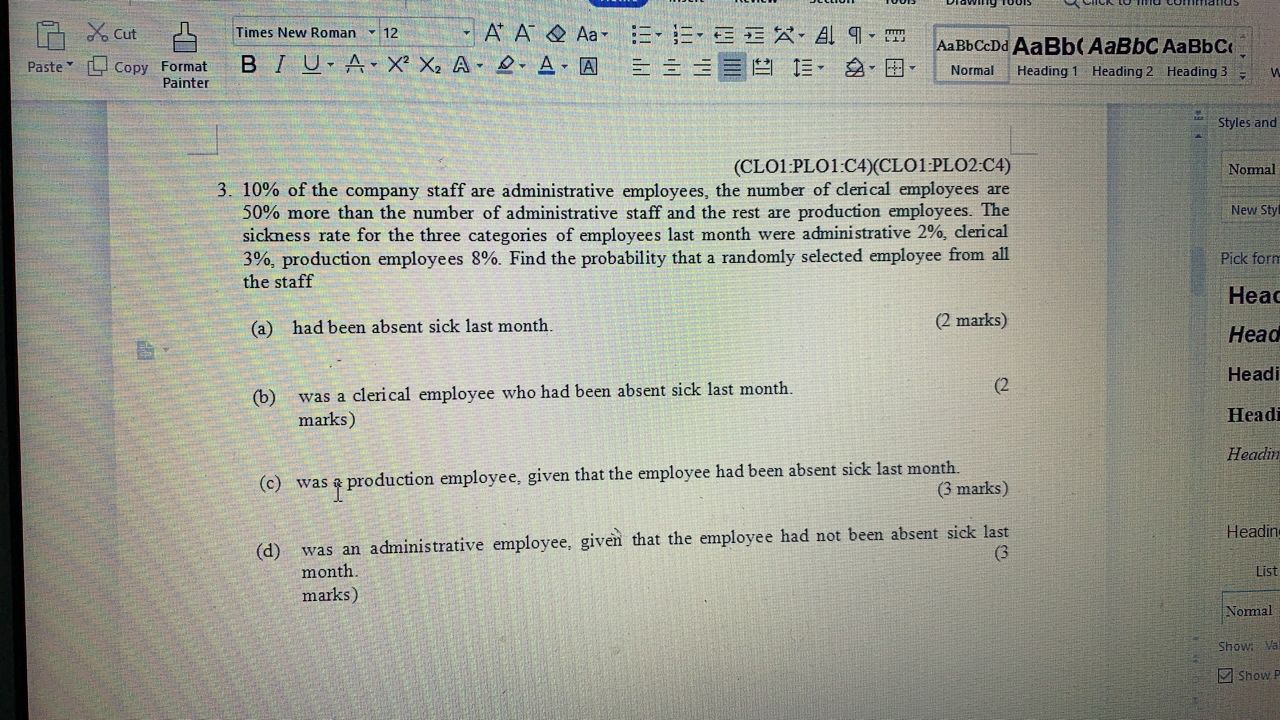
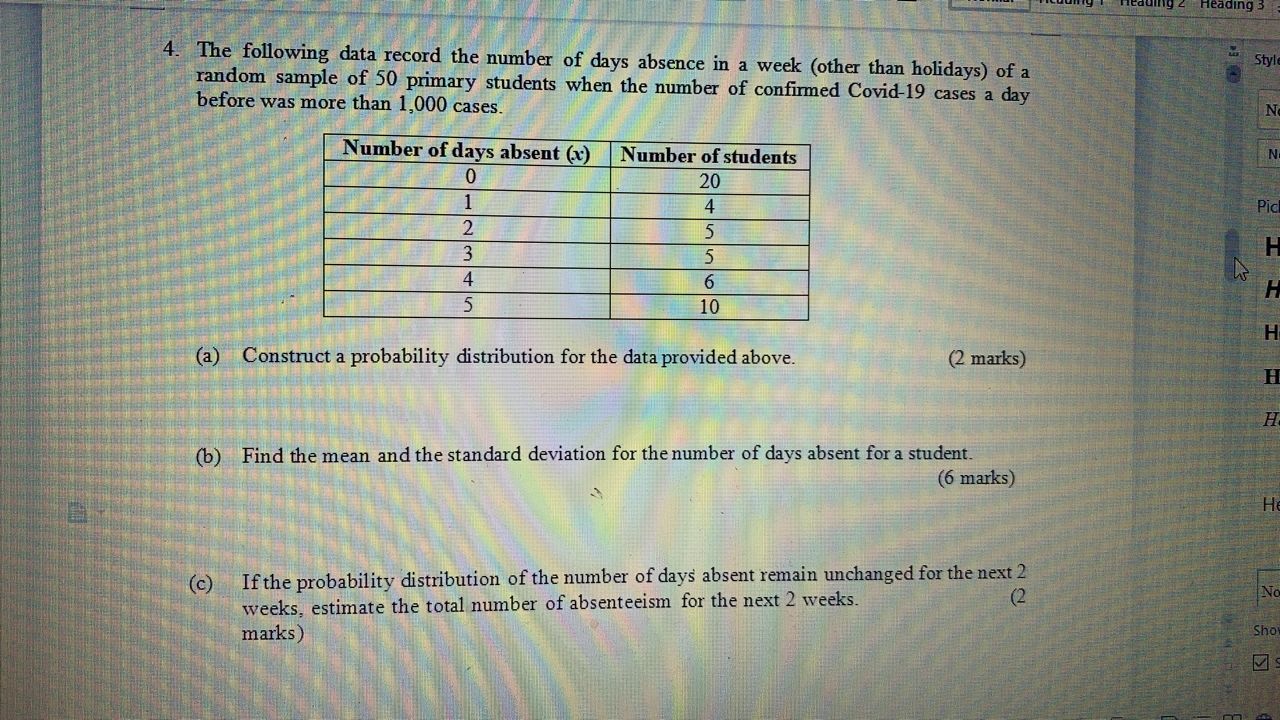
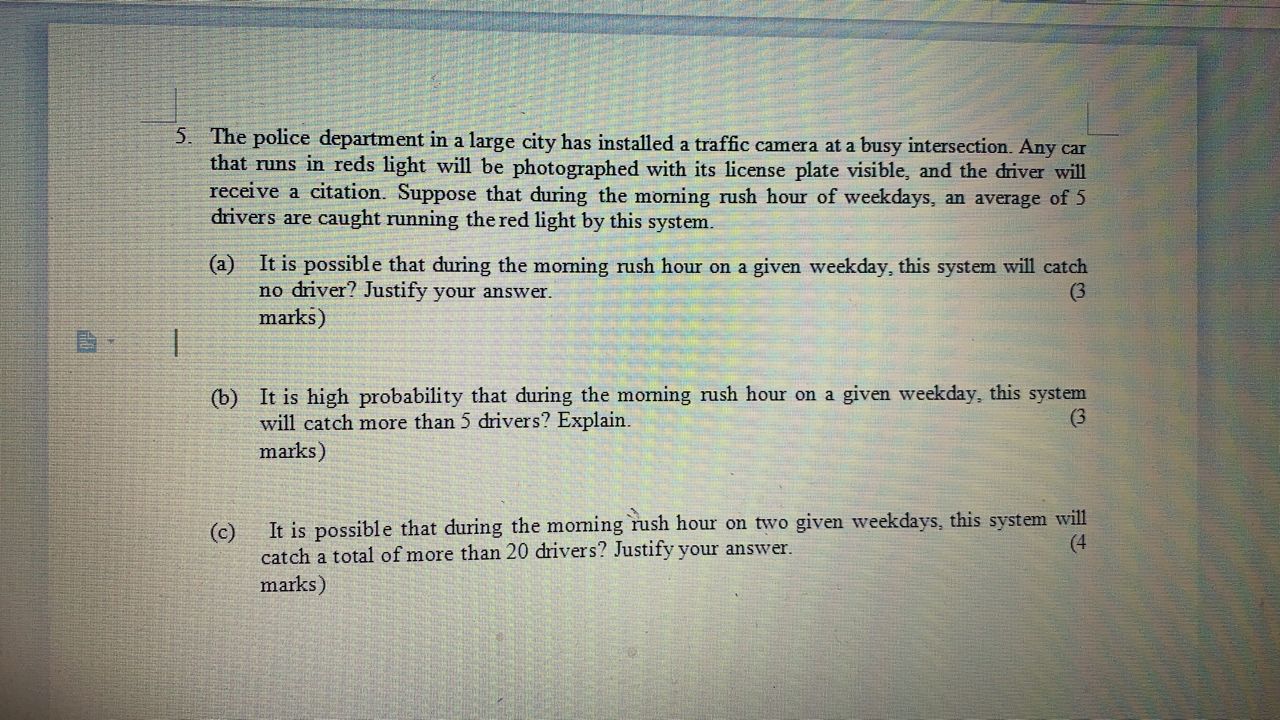
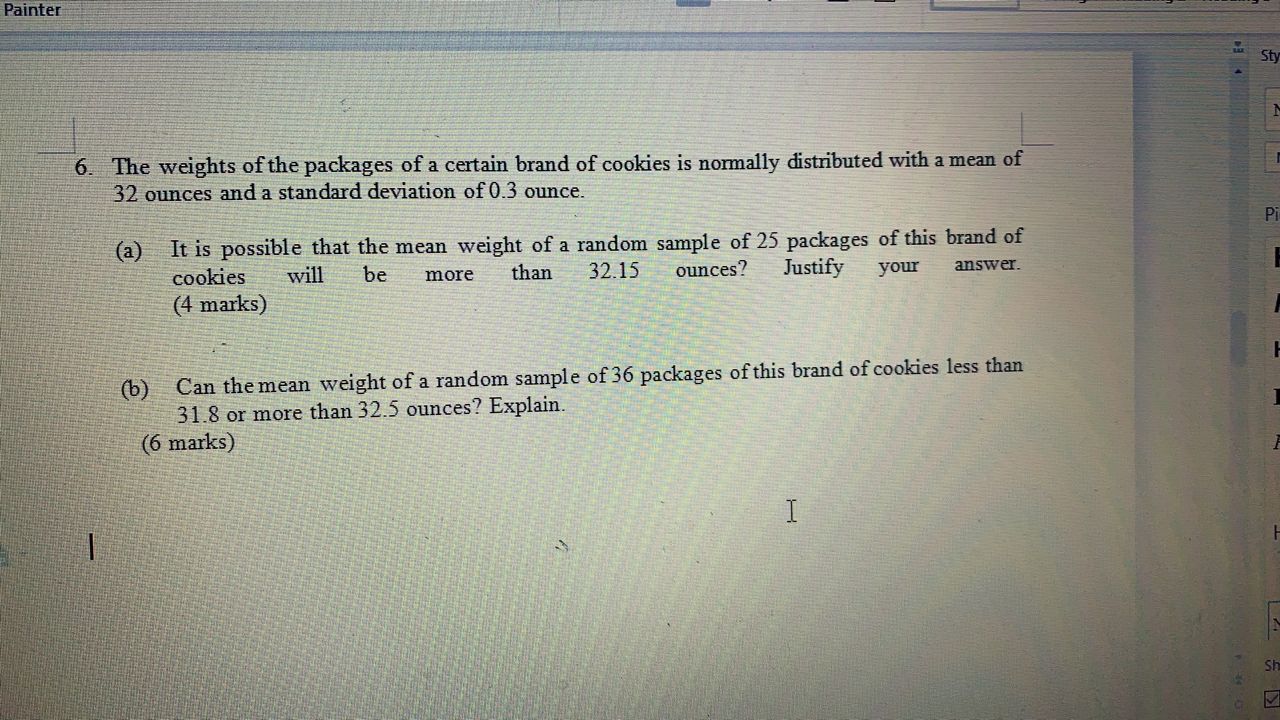
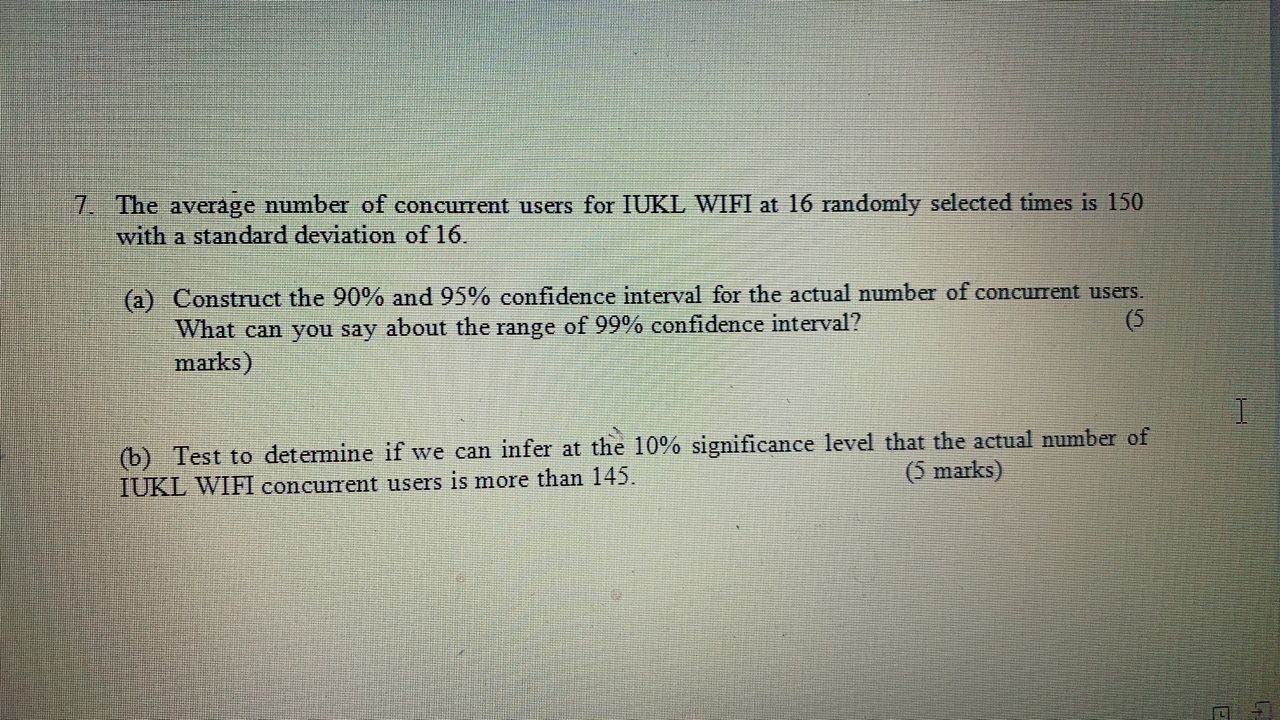
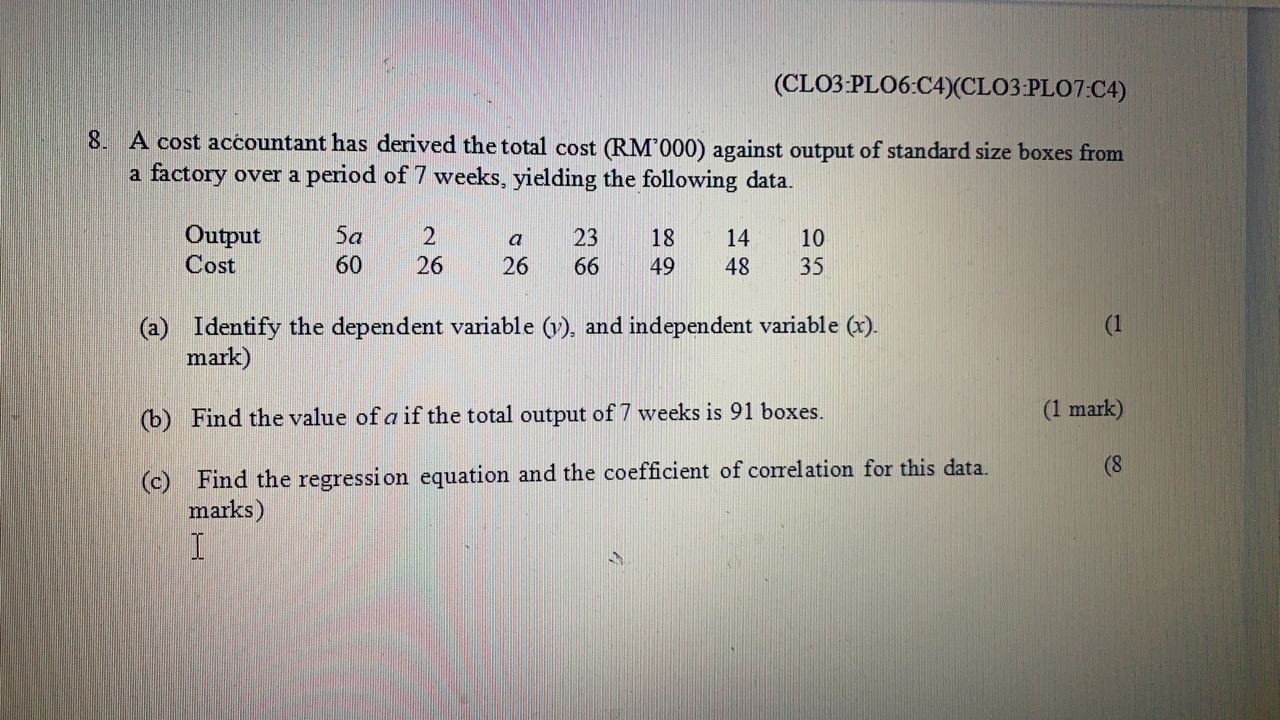
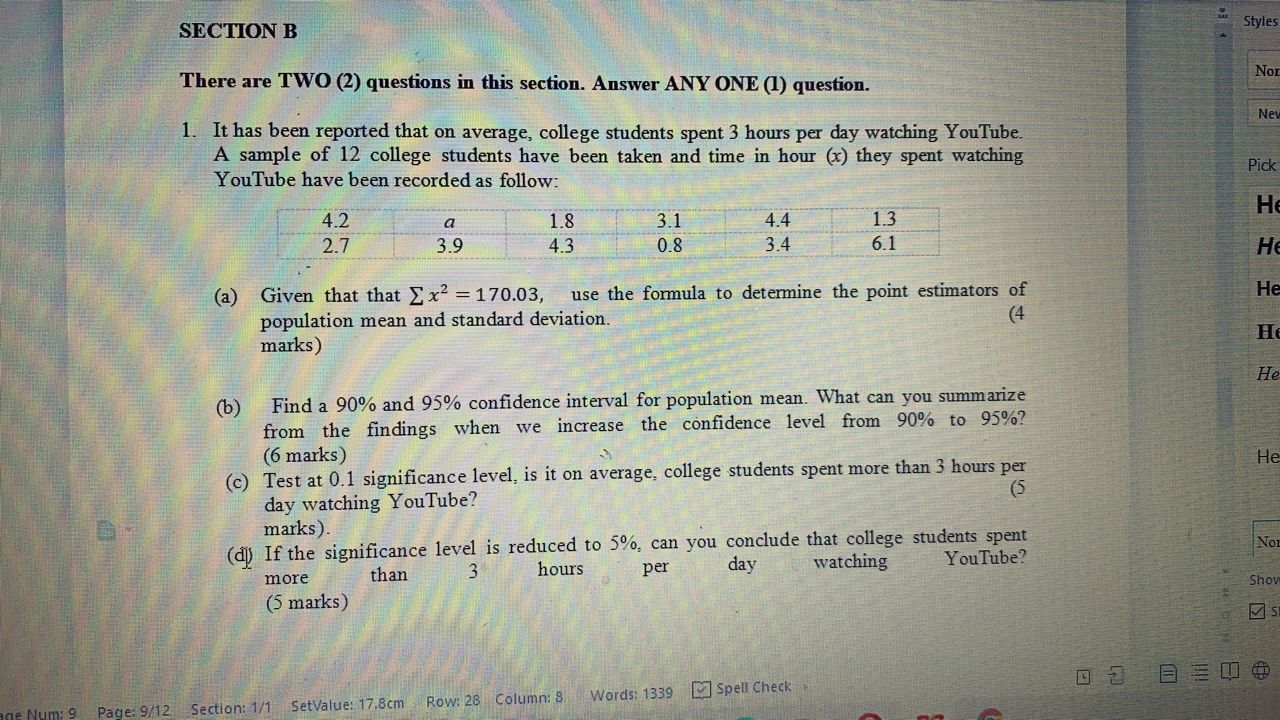
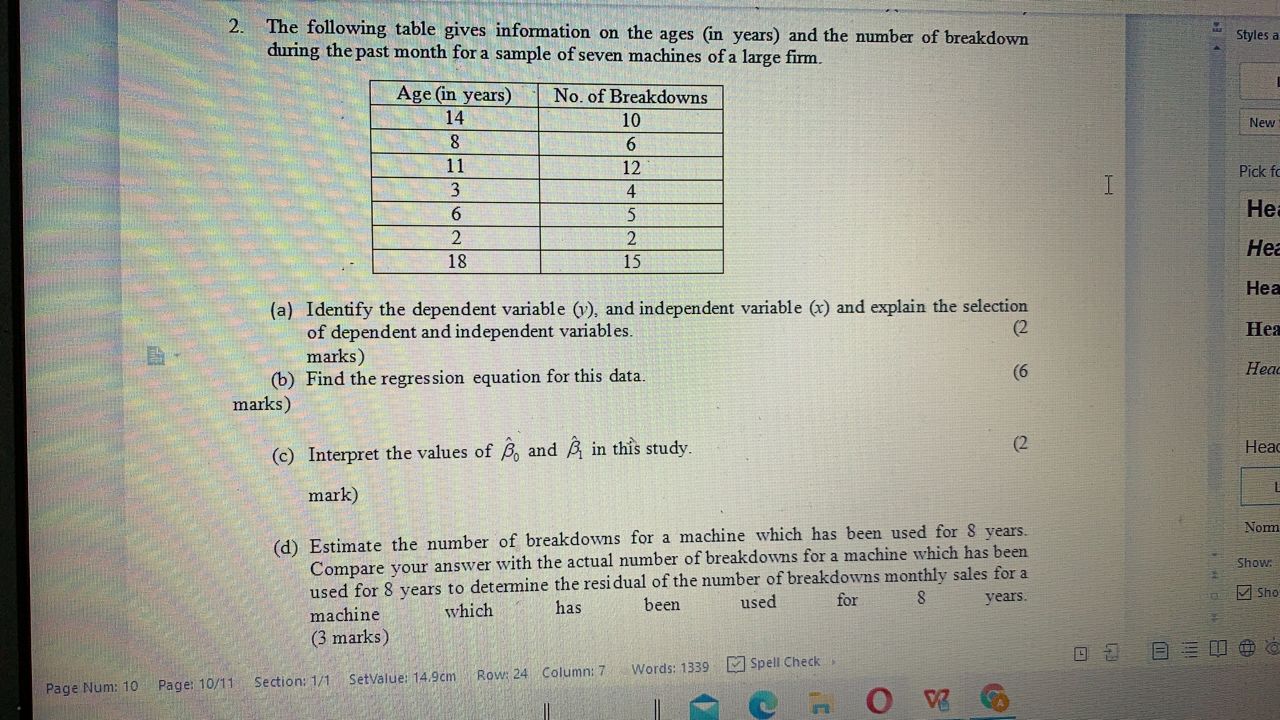
(CLO2:PLO4:C3)(CLO2:PLO7:C3) FORMULA SHEET Sturges Rule: No. of classes : c=1+3.3logn iz range Class width : C Arithmetic mean : n n [X () if n is odd X - L + 2 - F Median : + x() if niseven Mode : Standard deviation : 1- 1 s = n-1 IQR : 2 -2 O, at "+ th term 4 Q, at 3(n + 12 th term 3(mean - median) mean - mode Coefficient of skewness : standard deviation Or standard deviation standard deviation Coefficient of variation : x 100% mean Probability : P(AUB) = P(A) + P(B) mutually exclusive events P(AUB) - P(A) + P(B) - P(AnB) not mutually exclusive events P(AnB) - P(A)P(B) independents events P( A/ B) = P(An B) P(B) conditional probability Page 1 of 7 + 15SECTION A (80 Marks) There are EIGHT (8) questions in this section and answer ALL Questions. 1. The following data give the number of orders received for a sample of 23 hours at the Time- Saver Mail Order Company. 33 44 31 52 47 38 35 32 28 24 46 41 53 57 33 27 27 45 38 34 46 36 a (a) Given that _ x =897 and X x2 = 36,891, find the mean and standard deviation of this data. (2 marks) (b) Construct the stem-and-leaf diagram for the above data. (3 marks) (b) Find the first quartile and median of this data. (4 marks) (c) (d) Calculate the skewness coefficient of this data. [(1 mark) Spell CheckA & Aa : L Copy Format B / U - A . X X A - D. A- A AaBbCcDd AaBbCcDd AaBbCcDd AaBbCcDi FA Painter Body Text... Comment ... Commen... Comment. Word Typesetting 2. A sample of voters in a town are classified by age groups, as shown by the following: Styles and Formatting Age Group Number of voters 21 - 30 12 Body Text Indent 3 31 -40 2z 41-50 15 New Style... Clear 51 -60 18 61 - 70 Pick formatting to ap 71 -80 11 81 -90 Body Text Indent 3 8 Comment Reference (a) Find the mean and standard deviation of the age of these voters. (6 marks) Comment Subject Age Group X Comment Text 21 - 30 12 31 -40 Default Paragraph Fo 41 -50 15 51 - 60 18 Footer 61 -70 Header 71 -80 11 81 - 90 8 Heading 1 Total Headina 2 Show: Valid styles (b) If another sample is taken from the same town the and the results showed that the mean and standard deviation was 45 and 12.5 years old respectively. Which sample data has a higher Show Previews reliability? Justify your answer. (4 marks)to Cut Times New Roman * 12 A A Q Aa- E.SEX. A9." AaBbCcDd AaBb( AaBbC AaBbCom Paste" Copy Format BI U- A - X X A - DA-A Painter Normal Heading 1 Heading 2 Heading 3- Styles and (CLO1:PLO1:C4)(CLO1:PLO2:C4) Normal 3. 10% of the company staff are administrative employees, the number of clerical employees are 50% more than the number of administrative staff and the rest are production employees. The New Sty sickness rate for the three categories of employees last month were administrative 2%, clerical 3%, production employees 8%. Find the probability that a randomly selected employee from all Pick forn the staff Head (a) had been absent sick last month. (2 marks) Head (2 Headi (b) was a clerical employee who had been absent sick last month. marks) Head Headin (c) was a production employee, given that the employee had been absent sick last month. (3 marks) (d) was an administrative employee, given that the employee had not been absent sick last Headin (3 month. List marks) Normal Show Va Show PHeading s Styl 4. The following data record the number of days absence in a week (other than holidays) of a random sample of 50 primary students when the number of confirmed Covid-19 cases a day N before was more than 1,000 cases. N Number of days absent (x) Number of students 0 20 Pic H 5 H A 6 10 H (a) Construct a probability distribution for the data provided above. (2 marks) H H (b) Find the mean and the standard deviation for the number of days absent for a student. (6 marks) H (c) If the probability distribution of the number of days absent remain unchanged for the next 2 (2 No weeks, estimate the total number of absenteeism for the next 2 weeks. Sho marks)5. The police department in a large city has installed a traffic camera at a busy intersection. Any car that runs in reds light will be photographed with its license plate visible, and the driver will receive a citation. Suppose that during the morning rush hour of weekdays, an average of 5 drivers are caught running the red light by this system. (a) It is possible that during the morning rush hour on a given weekday, this system will catch no driver? Justify your answer. (3 marks) (b) It is high probability that during the morning rush hour on a given weekday, this system will catch more than 5 drivers? Explain. (3 marks) (c) It is possible that during the morning rush hour on two given weekdays, this system will catch a total of more than 20 drivers? Justify your answer. (4 marks)Painter Sty 6. The weights of the packages of a certain brand of cookies is normally distributed with a mean of 32 ounces and a standard deviation of 0.3 ounce. Pi (a) It is possible that the mean weight of a random sample of 25 packages of this brand of cookies will be more than 32.15 ounces? Justify your answer. (4 marks) (b) Can the mean weight of a random sample of 36 packages of this brand of cookies less than 31.8 or more than 32.5 ounces? Explain (6 marks) H Sh7. The average number of concurrent users for IUKL WIFI at 16 randomly selected times is 150 with a standard deviation of 16. (a) Construct the 90% and 95% confidence interval for the actual number of concurrent users. What can you say about the range of 99% confidence interval? (5 marks) (b) Test to determine if we can infer at the 10% significance level that the actual number of IUKL WIFI concurrent users is more than 145. (5 marks)(CLO3:PLO6:C4)(CLO3:PLO7:C4) 8. A cost accountant has derived the total cost (RM'000) against output of standard size boxes from a factory over a period of 7 weeks, yielding the following data. Output 5a 2 a 23 18 14 10 Cost 60 26 26 66 49 48 35 (a) Identify the dependent variable (y), and independent variable (x). (1 mark) (b) Find the value of a if the total output of 7 weeks is 91 boxes. (1 mark) (c) Find the regression equation and the coefficient of correlation for this data. (8 marks)SECTION B Styles There are TWO (2) questions in this section. Answer ANY ONE (1) question. No 1. It has been reported that on average, college students spent 3 hours per day watching YouTube. Ne A sample of 12 college students have been taken and time in hour (x) they spent watching YouTube have been recorded as follow: Pick 4.2 a 1.8 3.1 4.4 1.3 H 2.7 3.9 4.3 0.8 3.4 6.1 H (a) Given that that E x2 =170.03, use the formula to determine the point estimators of He population mean and standard deviation. (4 marks) H He (b) Find a 90% and 95% confidence interval for population mean. What can you summarize from the findings when we increase the confidence level from 90% to 95%? (6 marks) (c) Test at 0.1 significance level, is it on average, college students spent more than 3 hours per HE day watching YouTube? (5 marks). (d) If the significance level is reduced to 5%, can you conclude that college students spent No hours per day watching You Tube? more than Show (5 marks) Page: 9/12 Section: 1/1 SetValue: 17.8cm Row: 28 Column: 8 Words: 1339 Spell Check Num: 92. The following table gives information on the ages (in years) and the number of breakdown Styles a during the past month for a sample of seven machines of a large firm. Age (in years) No. of Breakdowns 14 10 New 8 6 11 12 Pick fo 3 H 4 6 5 He 2 2 He 18 15 Hea (a) Identify the dependent variable (v), and independent variable (x) and explain the selection of dependent and independent variables. (2 He marks) (b) Find the regression equation for this data. (6 Hea marks) (c) Interpret the values of Bo and B, in this study. (2 Hea mark) (d) Estimate the number of breakdowns for a machine which has been used for 8 years. Norm Compare your answer with the actual number of breakdowns for a machine which has been Show: used for 8 years to determine the residual of the number of breakdowns monthly sales for a has used machine which for Sho been years (3 marks) Spell Check Page Num: 10 Page: 10/11 Section: 1/1 SetValue: 14.9cm Row: 24 Column: 7 Words: 1339 O V
Step by Step Solution
There are 3 Steps involved in it

Get step-by-step solutions from verified subject matter experts