

Question: please Using the dataset: Y X 0.07 9.0 0.09 9.0 0.08 9.0 0.16 7.0 0.17 7.0 0.21 7.0 0.49 5.0 0.58 5.0 0.53 5.0 1.22
please Using the dataset: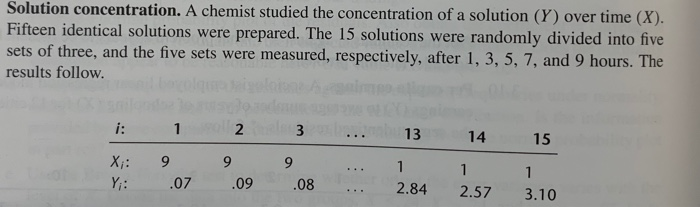
Y X
0.07 9.0
0.09 9.0
0.08 9.0
0.16 7.0
0.17 7.0
0.21 7.0
0.49 5.0
0.58 5.0
0.53 5.0
1.22 3.0
1.15 3.0
1.07 3.0
2.84 1.0
2.57 1.0
3.10 1.0
Answer the following questions:
Additional information: Figure3.15 as mentioned in part a:
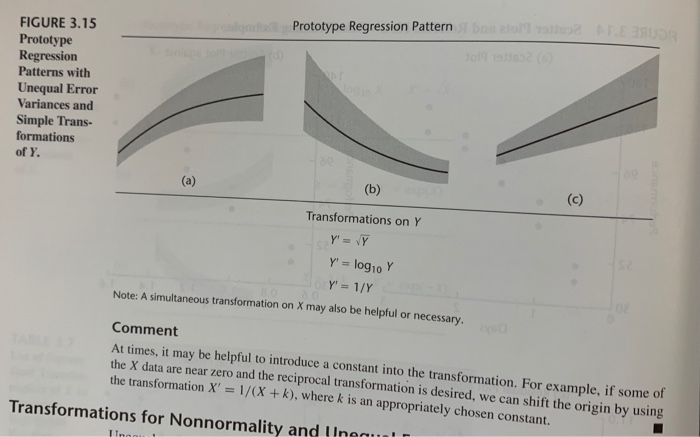
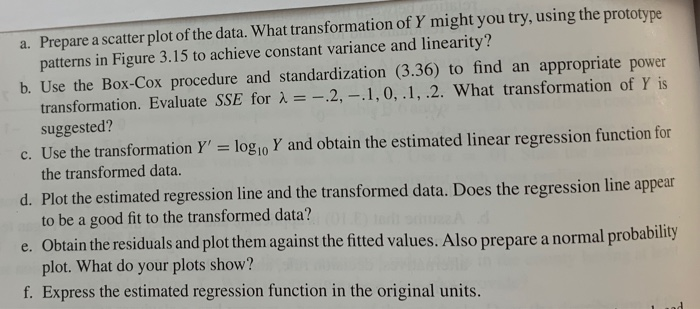
Solution concentration. A chemist studied the concentration of a solution (Y) over time (X). Fifteen identical solutions were prepared. The 15 solutions were randomly divided into five sets of three, and the five sets were measured, respectively, after 1, 3, 5, 7, and 9 hours. The results follow. i: 1 2 3 13 14 15 X;: Y 9 .07 1 9 .09 9 .08 1 2.84 2.57 3.10 a. Prepare a scatter plot of the data. What transformation of Y might you try, using the prototype patterns in Figure 3.15 to achieve constant variance and linearity? b. Use the Box-Cox procedure and standardization (3.36) to find an appropriate power transformation. Evaluate SSE for 2 = -2,-.1, 0.1,.2. What transformation of Y is suggested? c. Use the transformation Y' = log10 Y and obtain the estimated linear regression function for the transformed data. d. Plot the estimated regression line and the transformed data. Does the regression line appear to be a good fit to the transformed data? e. Obtain the residuals and plot them against the fitted values. Also prepare a normal probability plot. What do your plots show? f. Express the estimated regression function in the original units. Prototype Regression Pattern beoloasun FIGURE 3.15 Prototype Regression Patterns with Unequal Error Variances and Simple Trans- formations of Y. (a) (b) (c) Transformations on Y Y' =VY Y' = = logo Y Y' = 1/Y Note: A simultaneous transformation on X may also be helpful or necessary. Comment At times, it may be helpful to introduce a constant into the transformation. For example, if some of the X data are near zero and the reciprocal transformation is desired, we can shift the origin by using the transformation X' = 1/(X + k), where k is an appropriately chosen constant. Transformations for Nonnormality and Ungau TI Solution concentration. A chemist studied the concentration of a solution (Y) over time (X). Fifteen identical solutions were prepared. The 15 solutions were randomly divided into five sets of three, and the five sets were measured, respectively, after 1, 3, 5, 7, and 9 hours. The results follow. i: 1 2 3 13 14 15 X;: Y 9 .07 1 9 .09 9 .08 1 2.84 2.57 3.10 a. Prepare a scatter plot of the data. What transformation of Y might you try, using the prototype patterns in Figure 3.15 to achieve constant variance and linearity? b. Use the Box-Cox procedure and standardization (3.36) to find an appropriate power transformation. Evaluate SSE for 2 = -2,-.1, 0.1,.2. What transformation of Y is suggested? c. Use the transformation Y' = log10 Y and obtain the estimated linear regression function for the transformed data. d. Plot the estimated regression line and the transformed data. Does the regression line appear to be a good fit to the transformed data? e. Obtain the residuals and plot them against the fitted values. Also prepare a normal probability plot. What do your plots show? f. Express the estimated regression function in the original units. Prototype Regression Pattern beoloasun FIGURE 3.15 Prototype Regression Patterns with Unequal Error Variances and Simple Trans- formations of Y. (a) (b) (c) Transformations on Y Y' =VY Y' = = logo Y Y' = 1/Y Note: A simultaneous transformation on X may also be helpful or necessary. Comment At times, it may be helpful to introduce a constant into the transformation. For example, if some of the X data are near zero and the reciprocal transformation is desired, we can shift the origin by using the transformation X' = 1/(X + k), where k is an appropriately chosen constant. Transformations for Nonnormality and Ungau TI
Step by Step Solution
There are 3 Steps involved in it

Get step-by-step solutions from verified subject matter experts