

Question: Please view image and answer in table format 1. Considering that the probabilities applicable to demand are not known, show the decision recommendations from the
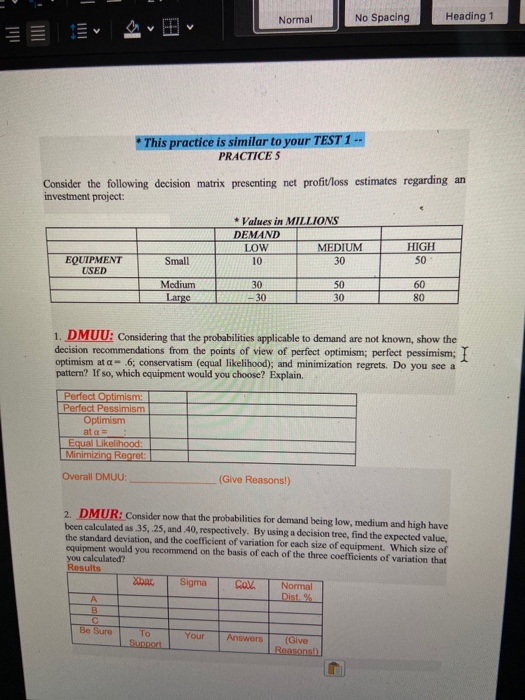
Normal No Spacing Heading 1 This practice is similar to your TEST 1 .. PRACTICES Consider the following decision matrix presenting net profit/loss estimates regarding an investment project: + Values in MILLIONS DEMAND LOW MEDIUM 10 30 HIGH 50 EQUIPMENT USED Small Medium Large 30 30 50 30 60 80 1. DMUU: Considering that the probabilities applicable to demand are not known, show the decision recommendations from the points of view of perfect optimism; perfect pessimism; optimism at a - .6; conservatism (equal likelihood); and minimization regrets. Do you see a pattern? If so, which equipment would you choose? Explain. Perfect Optimism Perfect Pessimism Optimism at a Equal Likelihood: Minimizing Regret Overall DMUU: (Give Reasons!) 2. DMUR: Consider now that the probabilities for demand being low, medium and high have been calculated as 35, 25, and 40, respectively. By using a decision tree, find the expected value, the standard deviation, and the coefficient of variation for each size of equipment. Which size of equipment would you recommend on the basis of each of the three coefficients of variation that you calculated? Results Sigma Com Normal A B Be Sure To Support Your Answers (Give Reasons
Step by Step Solution
There are 3 Steps involved in it

Get step-by-step solutions from verified subject matter experts