

Question: Please walkthrough with R commands when needed Bottle Return dataset: Number Returned Number Sold Deposit level 14 100 2 21 100 5 34 100 10
Please walkthrough with R commands when needed
Bottle Return dataset:
| Number Returned | Number Sold | Deposit level |
| 14 | 100 | 2 |
| 21 | 100 | 5 |
| 34 | 100 | 10 |
| 59 | 100 | 20 |
| 81 | 100 | 25 |
| 90 | 100 | 30 |
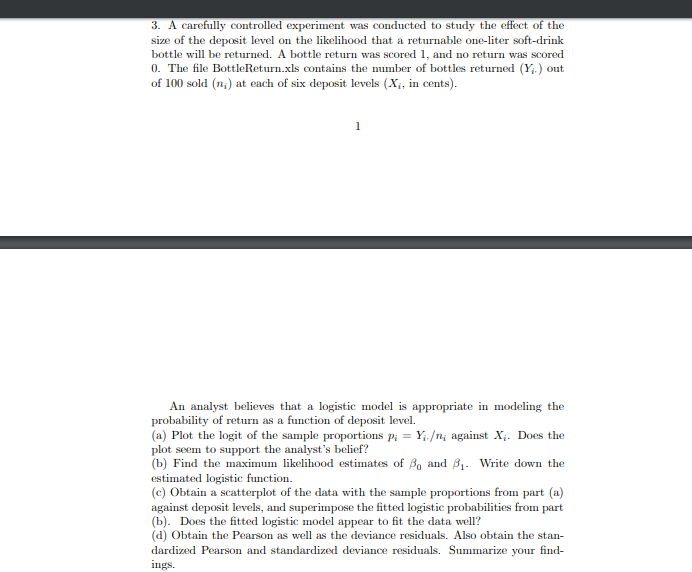
3. A carefully controlled experiment was conducted to study the effect of the size of the deposit level on the likelihood that a returnable one-liter soft-drink bottle will be returned. A bottle return was scored 1, and no return was scored 0. The file BottleReturn.xls contains the number of bottles returned (Y) out of 100 sold (ni) at each of six deposit levels (X, in cents). An analyst believes that a logistic model is appropriate in modeling the probability of return as a function of deposit level. (a) Plot the logit of the sample proportions Pi = Y.; against X. Does the plot seem to support the analyst's belief? (b) Find the maximum likelihood estimates of Bo and . Write down the estimated logistic function. (c) Obtain a scatterplot of the data with the sample proportions from part (a) against deposit levels, and superimpose the fitted logistic probabilities from part (b). Does the fitted logistic model appear to fit the data well? (d) Obtain the Pearson as well as the deviance residuals. Also obtain the stan- dardized Pearson and standardized deviance residuals. Summarize your find- ings. 3. A carefully controlled experiment was conducted to study the effect of the size of the deposit level on the likelihood that a returnable one-liter soft-drink bottle will be returned. A bottle return was scored 1, and no return was scored 0. The file BottleReturn.xls contains the number of bottles returned (Y) out of 100 sold (ni) at each of six deposit levels (X, in cents). An analyst believes that a logistic model is appropriate in modeling the probability of return as a function of deposit level. (a) Plot the logit of the sample proportions Pi = Y.; against X. Does the plot seem to support the analyst's belief? (b) Find the maximum likelihood estimates of Bo and . Write down the estimated logistic function. (c) Obtain a scatterplot of the data with the sample proportions from part (a) against deposit levels, and superimpose the fitted logistic probabilities from part (b). Does the fitted logistic model appear to fit the data well? (d) Obtain the Pearson as well as the deviance residuals. Also obtain the stan- dardized Pearson and standardized deviance residuals. Summarize your find- ings
Step by Step Solution
There are 3 Steps involved in it

Get step-by-step solutions from verified subject matter experts