

Question: please write a c++ program for the following, and please only use functions, graphics, and arrays Topic: Review of Arrays and Graphics - 20 Points
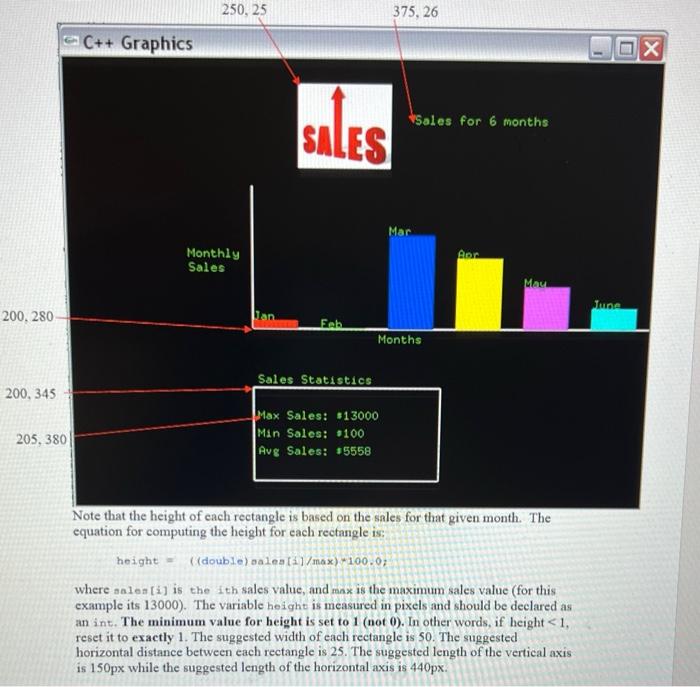
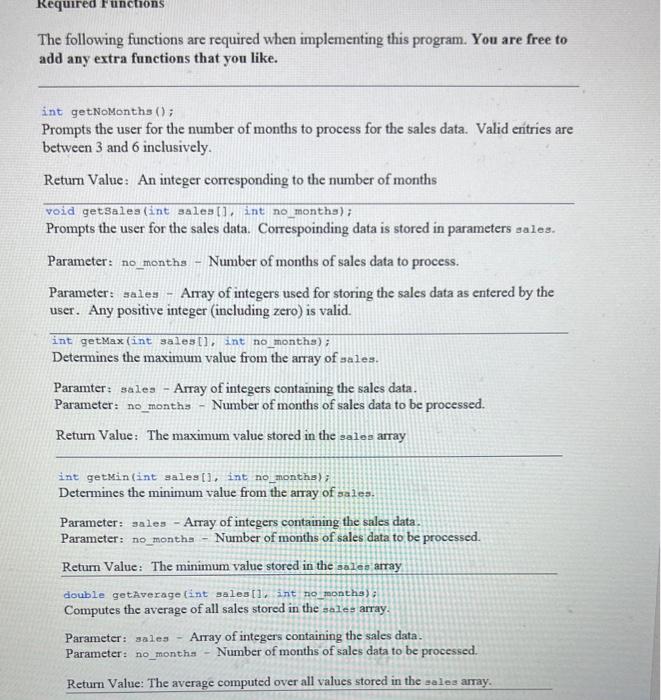
Topic: Review of Arrays and Graphics - 20 Points Reading: Ch. 7 and Supplement *Note: Include the following set of comments at the top of your source code for all assignments. //Your Name //Assignment \# (Example: Lab1out) /Brief description of the purpose of the program (Example: /Calculates the area of a square.) Overview (Save this file as lab1out.cpp) Write a C+ program that processes a set of sales data. Your program will first prompt the user for the number of months of sales data to process as shown below: Enter nunber of nonths to process: (between 3 and 6 inclusive):6 The minimum months that can be processed are 3 , while the maximum number of months that can be processed is 6 . A value of 6 is entered for the example given above. Next, the user is prompted for the sales data. The sales data should be stored as integer data within an integer array with the maximum number of elements set to 6 . Any nonzero integer value is valid. Example sales data entry is shown below: For this example, month \#1 corresponds to January, month \#2 corresponds to February, and so on up to June corresponding to month #6. This program will next display the sales data in the form of a bar chart. The bar chart that this program generates consists of the following: 1. An x/y axis 2. Rectangles representing the percentage of sales for a given month 3. The given month's abbreviation displayed above its rectangle 4. An image and text used as the bar chart's heading/title 5. An informational box containing a summary of the sale's data statistics Note that the netght of each rectangle is based on the sales for that given month. The equation for computing the height for each rectangle is: height=(double)sales[1]/mox)100.0z where anlen [i] is the ith sales value, and max is the maximum sales value (for this example its 13000 ). The variable height is measured in pixels and should be declared as an int. The minimum value for height is set to 1 (not 0 ). In other words, if height
Step by Step Solution
There are 3 Steps involved in it

Get step-by-step solutions from verified subject matter experts